Overview
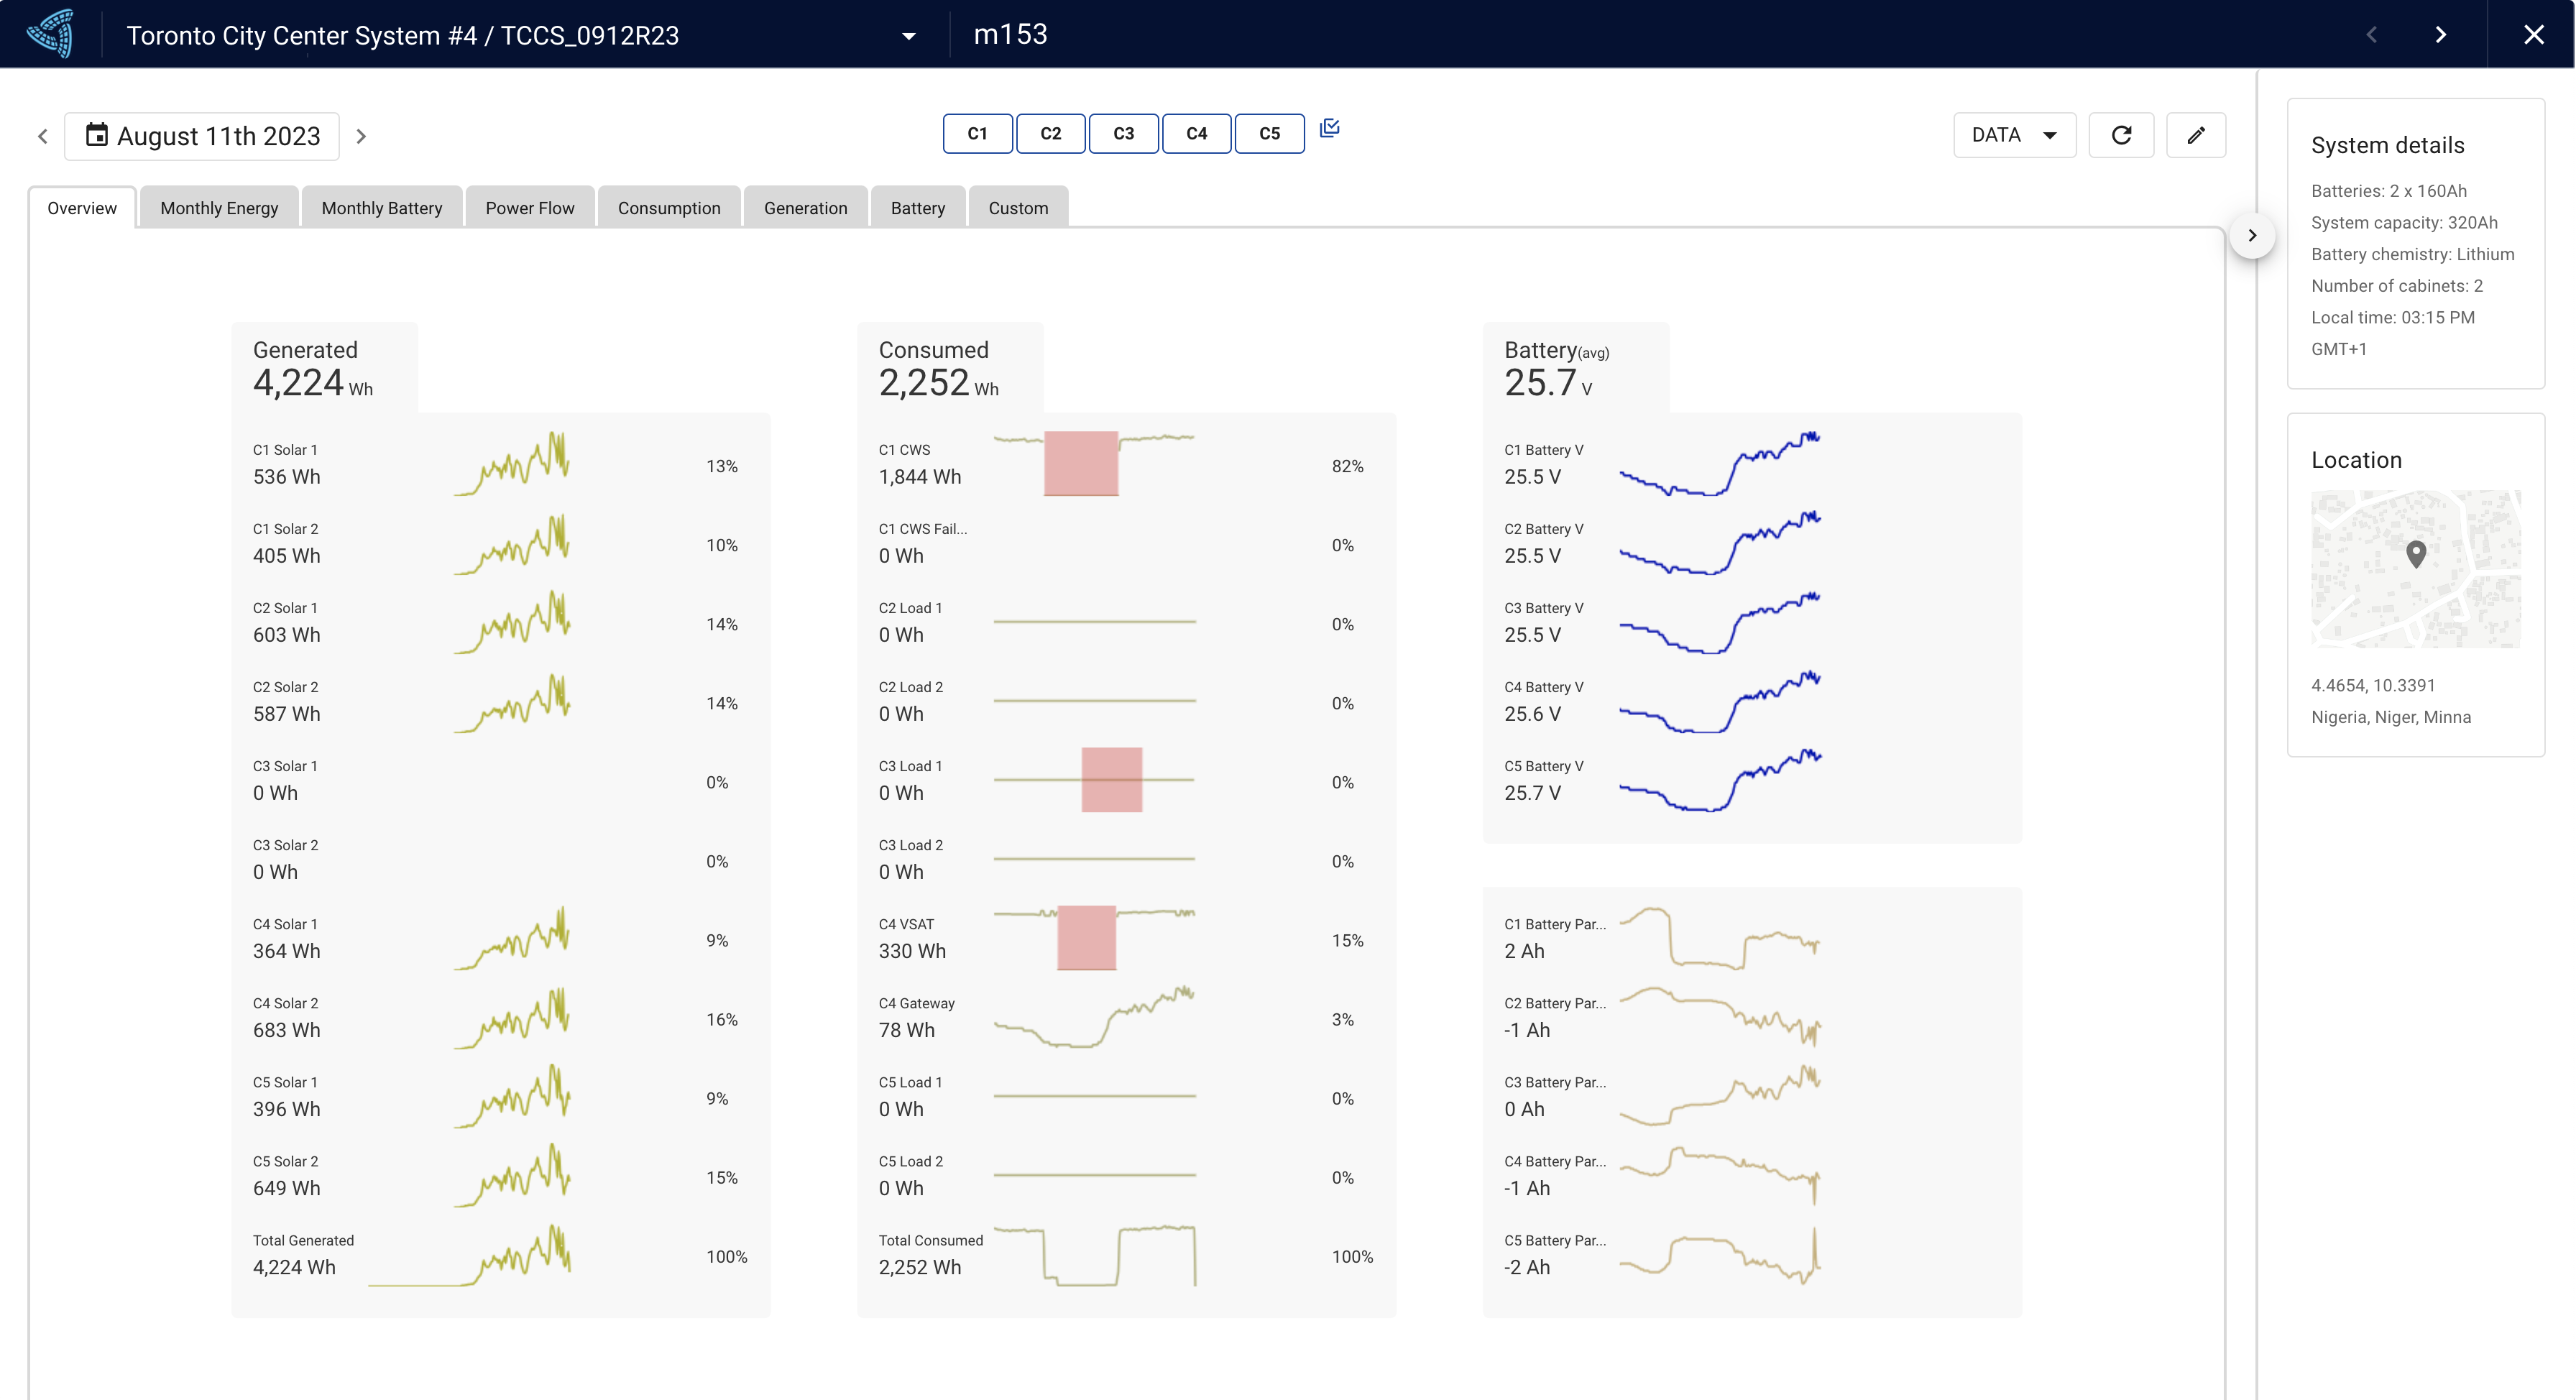
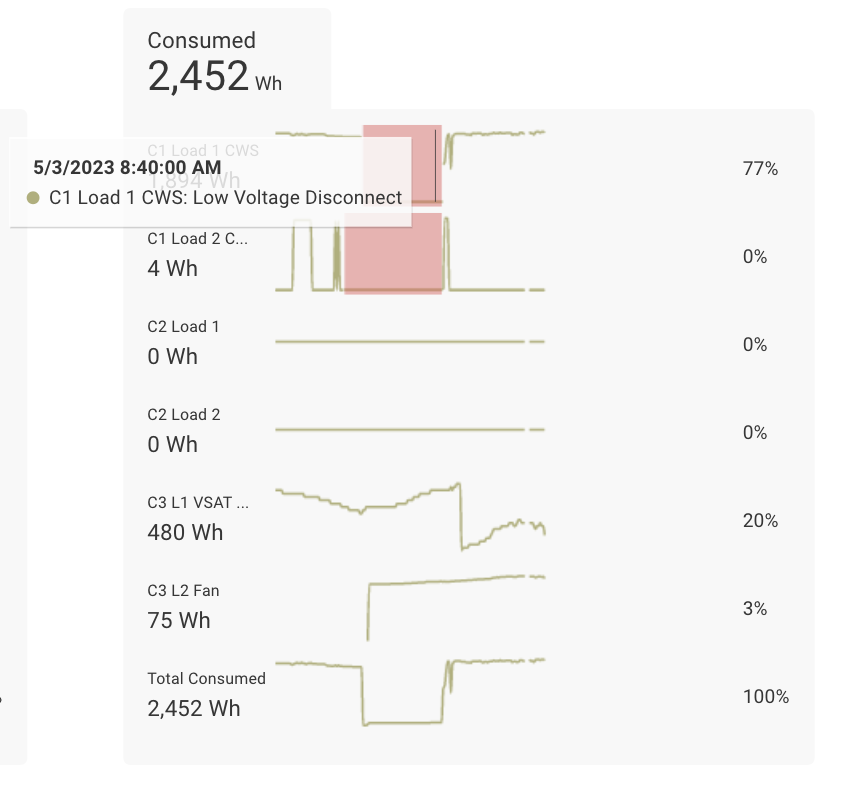
The Overview is a valuable tool that offers a quick snapshot of your system's recent performance, summarizing energy generated and consumed, battery trends, and key system information. The Generated and Consumed cards provide detailed information on energy production and consumption throughout the selected time period. They display the wattage for each port, total watt-hour consumption, and the percentage of consumption or generation compared to the overall system total.
Load Outages
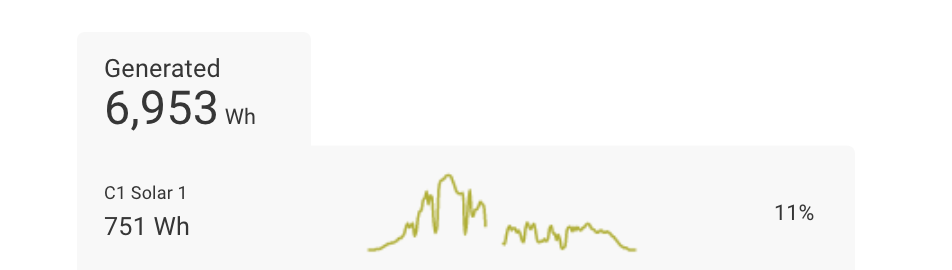
If your load has had an outage then the load wattage will highlight red and indicate the reasoning for the outage when you hover your mouse over it. The most typical outage reason is low voltage which means that the system has run out of energy. Some other lesser common faults could include short circuit or output overload, both of which should clear on their own. If they don't then contact support@clearbluetechnologies.com.
Right Panel
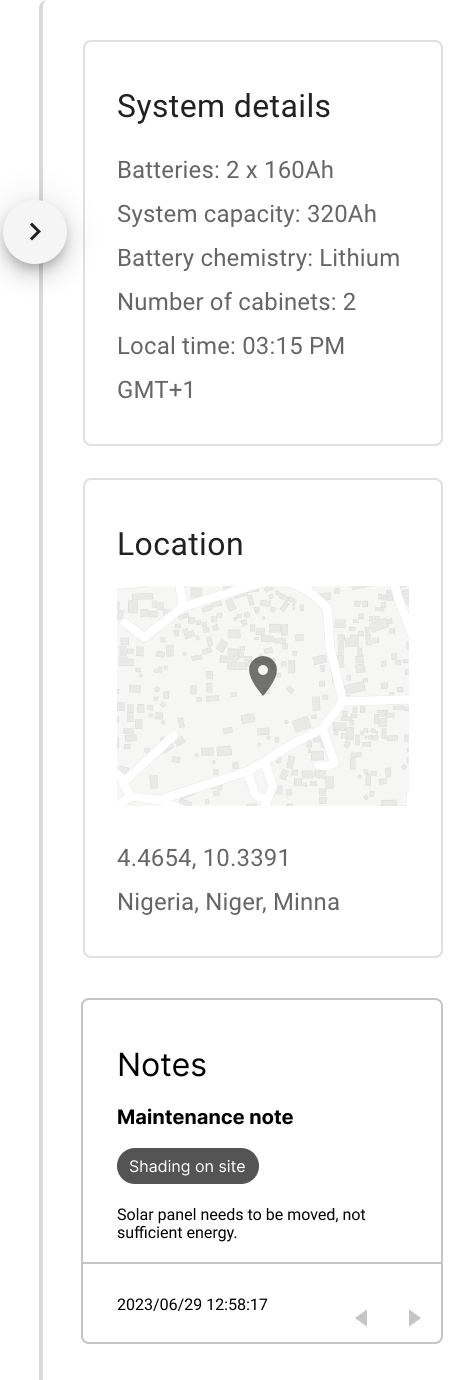
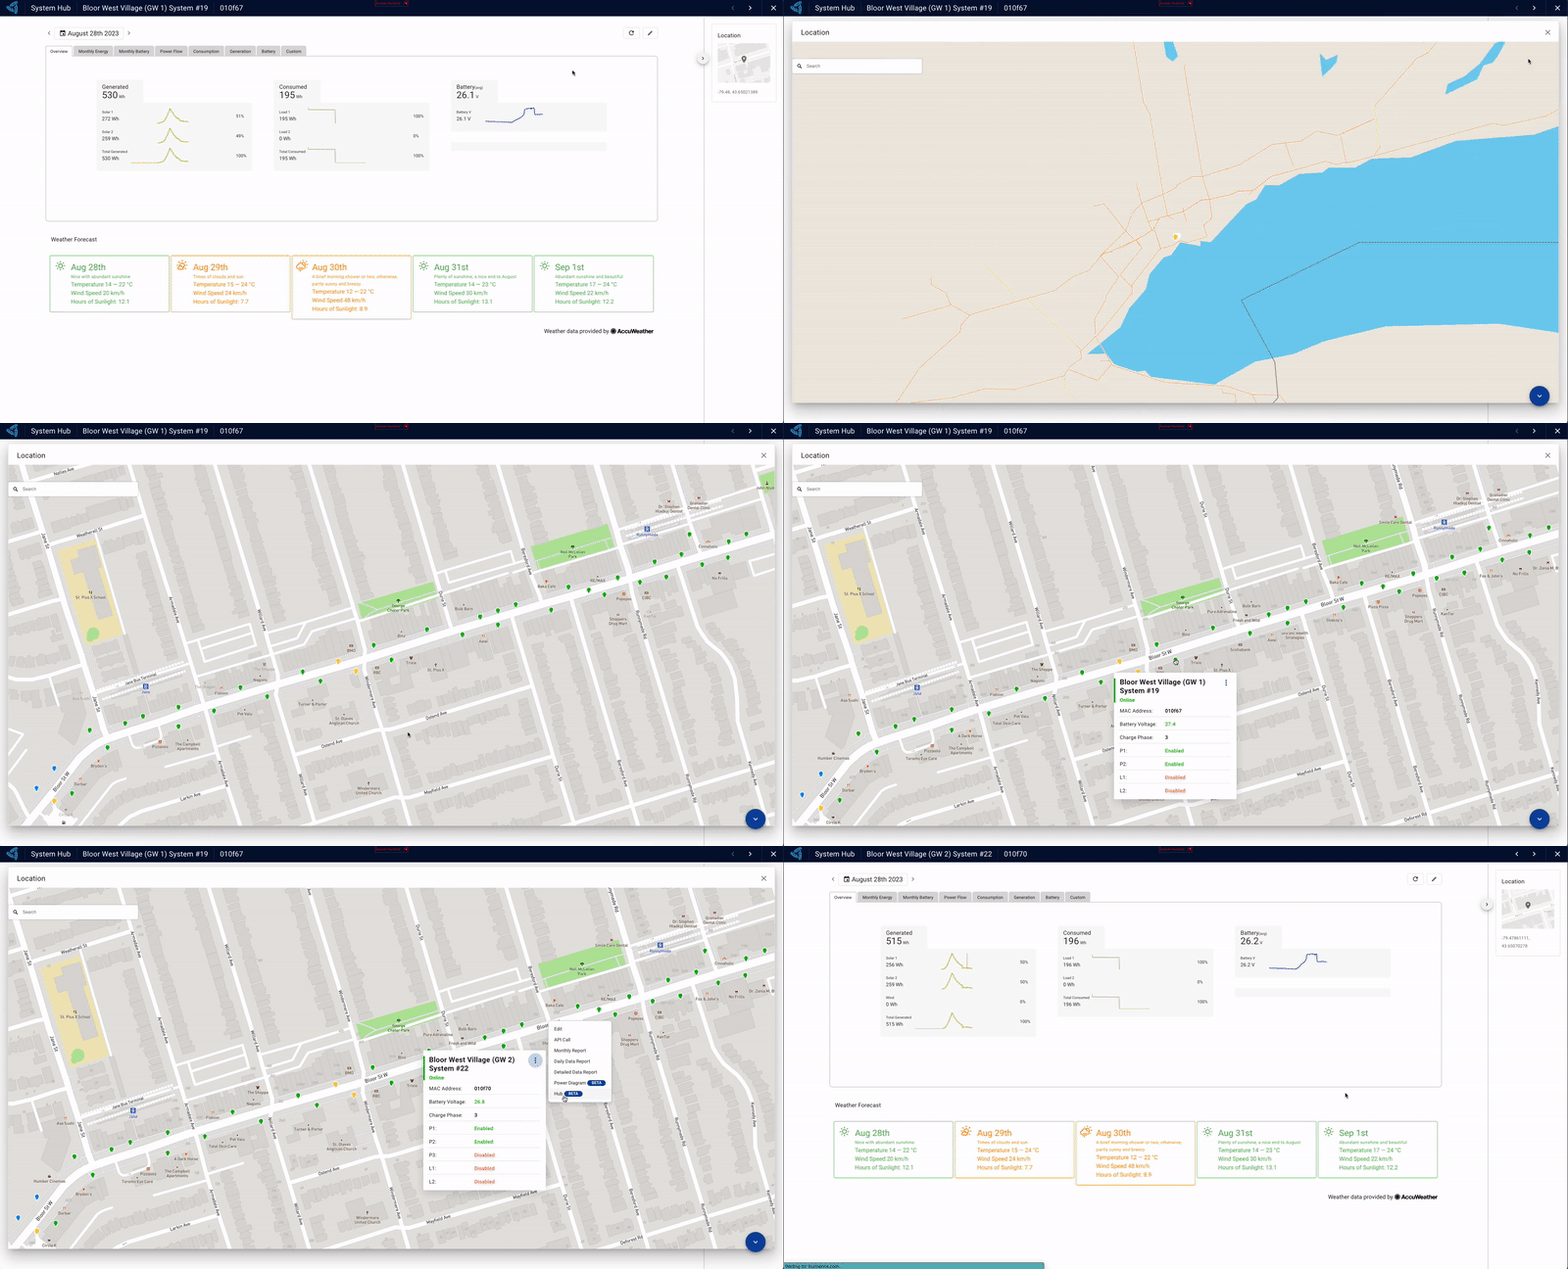
The right panel can be easily expanded or collapsed as needed. It provides an array of system details, encompassing essential information such as battery capacity, battery chemistry, cabinet count, and the current local time and timezone of the system's location. Additionally, it offers a map depiction of the system's placement. Clicking on this map initiates an interactive interface that allows you to explore nearby systems and conveniently access the hub of each respective system.
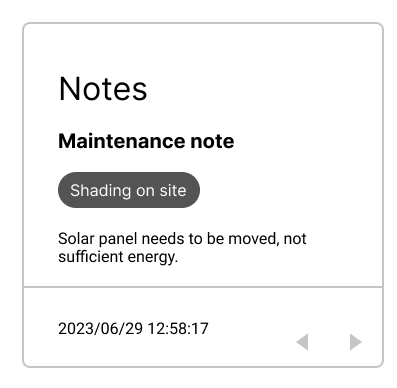
Lastly, the right panel also includes system/controller notes where you can see the whole history of when/why a system was put into maintenance or an incident was caught. For more information, check out Maintenance/Incidents.
Filtering Controllers
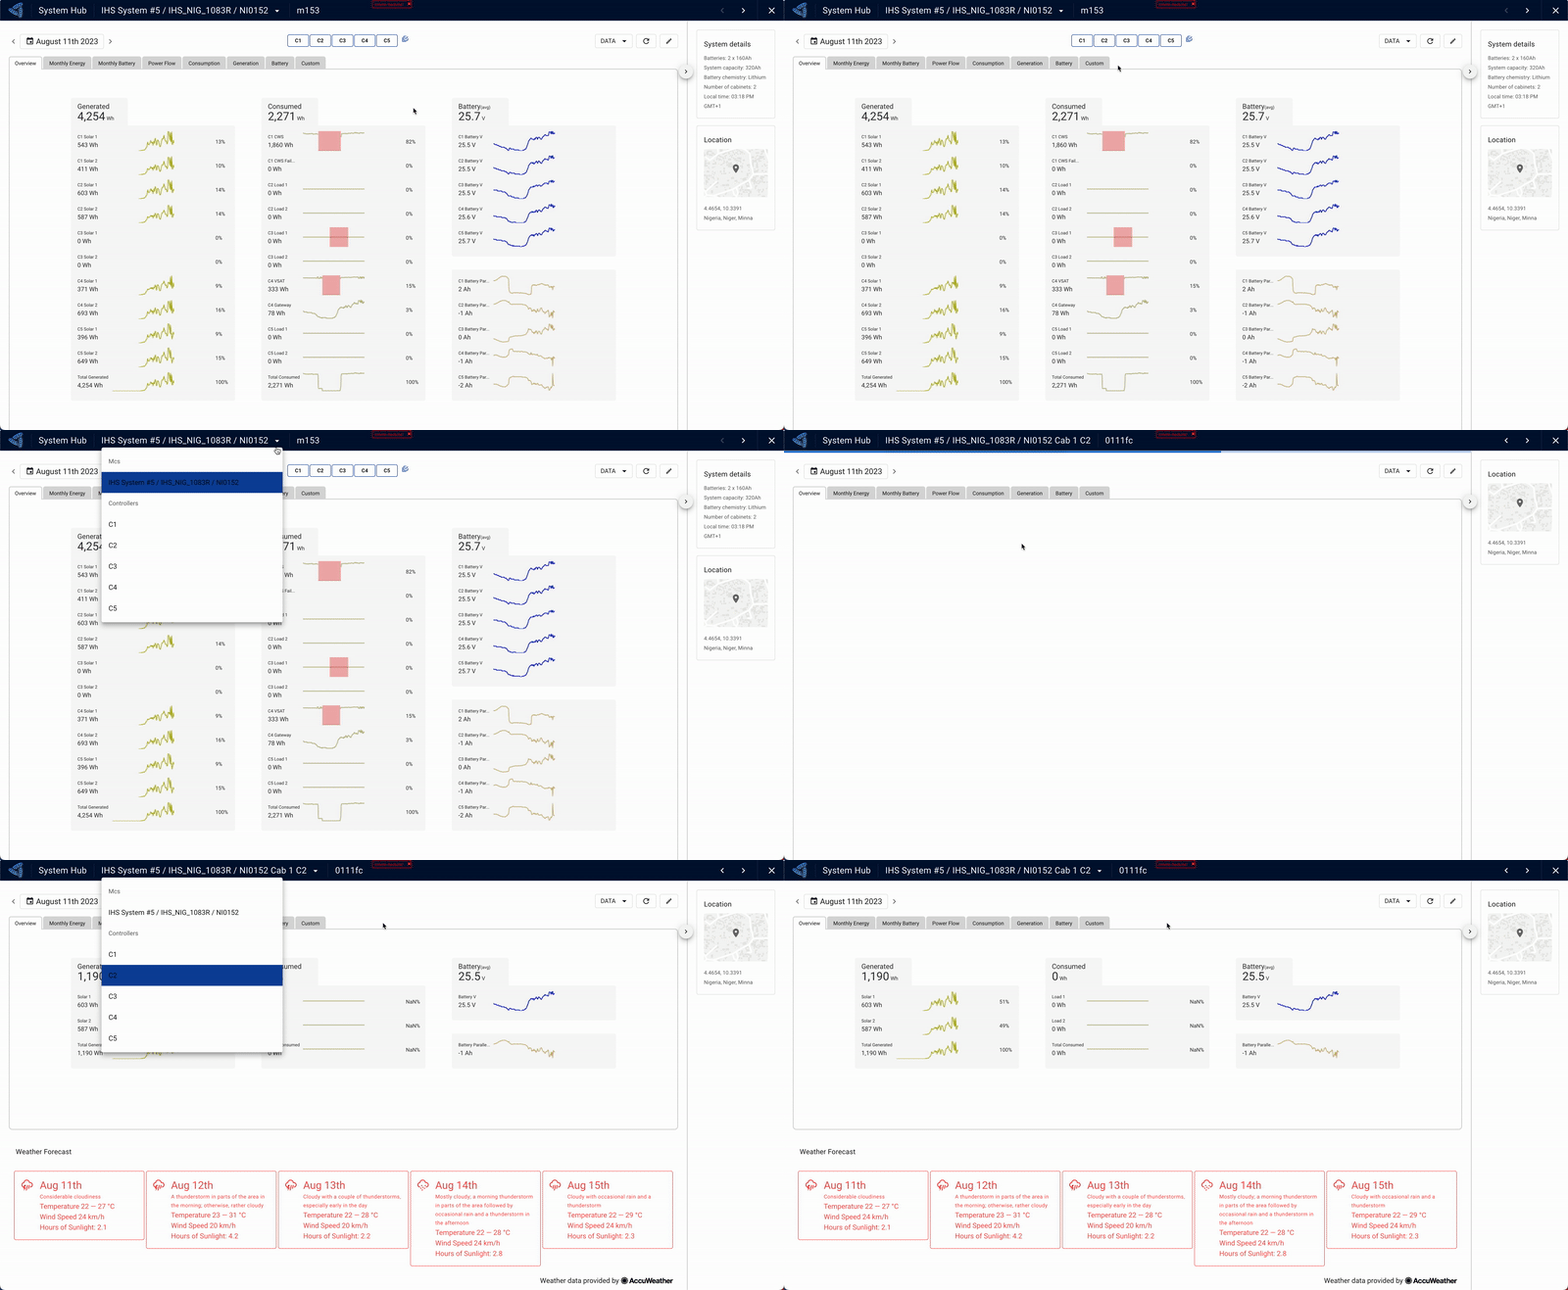
Depending on the type of system you have, you may have multiple controllers in the system. If you are interested in specific controllers, you can filter out the controllers and the data will adjust realtime. All summations and averages are also updated.
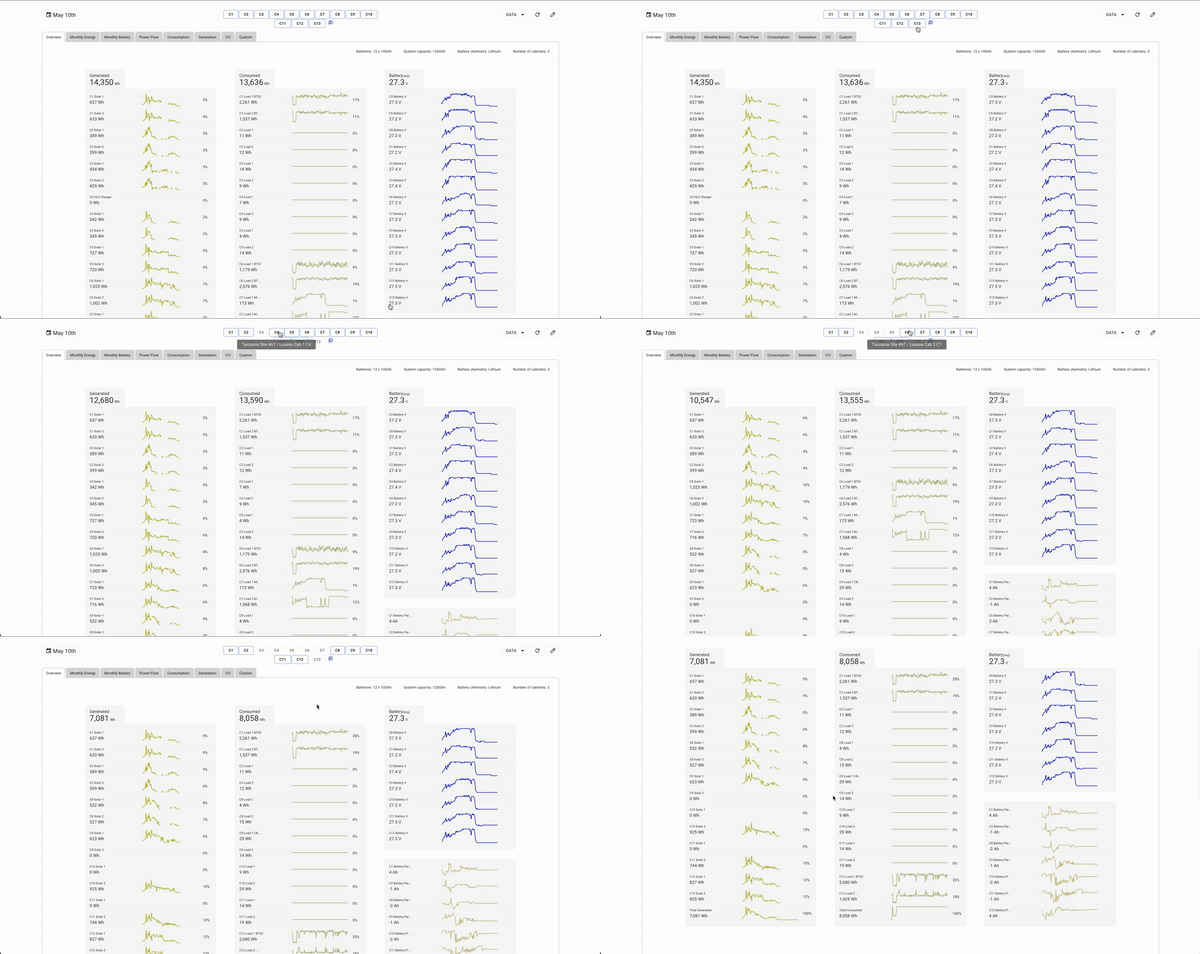
If you are curious in just one controller, unclick the select multiple systems button.
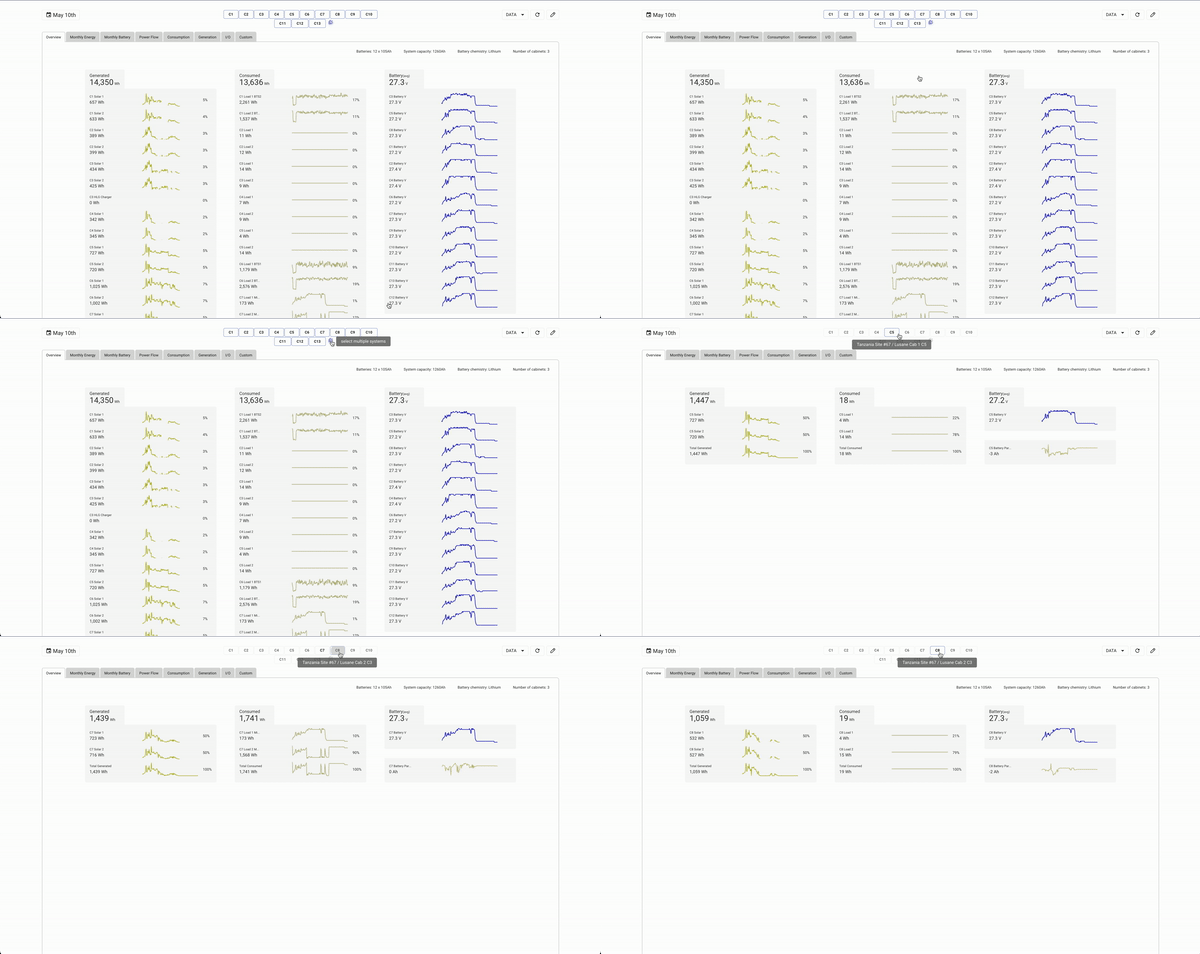
Alternatively, you have the option to access the controller hub through the system name at the top, providing smoother entry to the controller's settings. This grants you the ability to choose an extended range of days or months for data visibility on the chart, as you won't be querying data from all controllers.