
System and Device Charts
ℹ️ Will be replaced by the Hub in 2024.
Reports
By clicking on a particular system we come to a report with more detail. Whether you see a monthly report or a daily report will depend on what was chosen as default under preferences. Or they can be accessed throughout Illumience.
Monthly Report
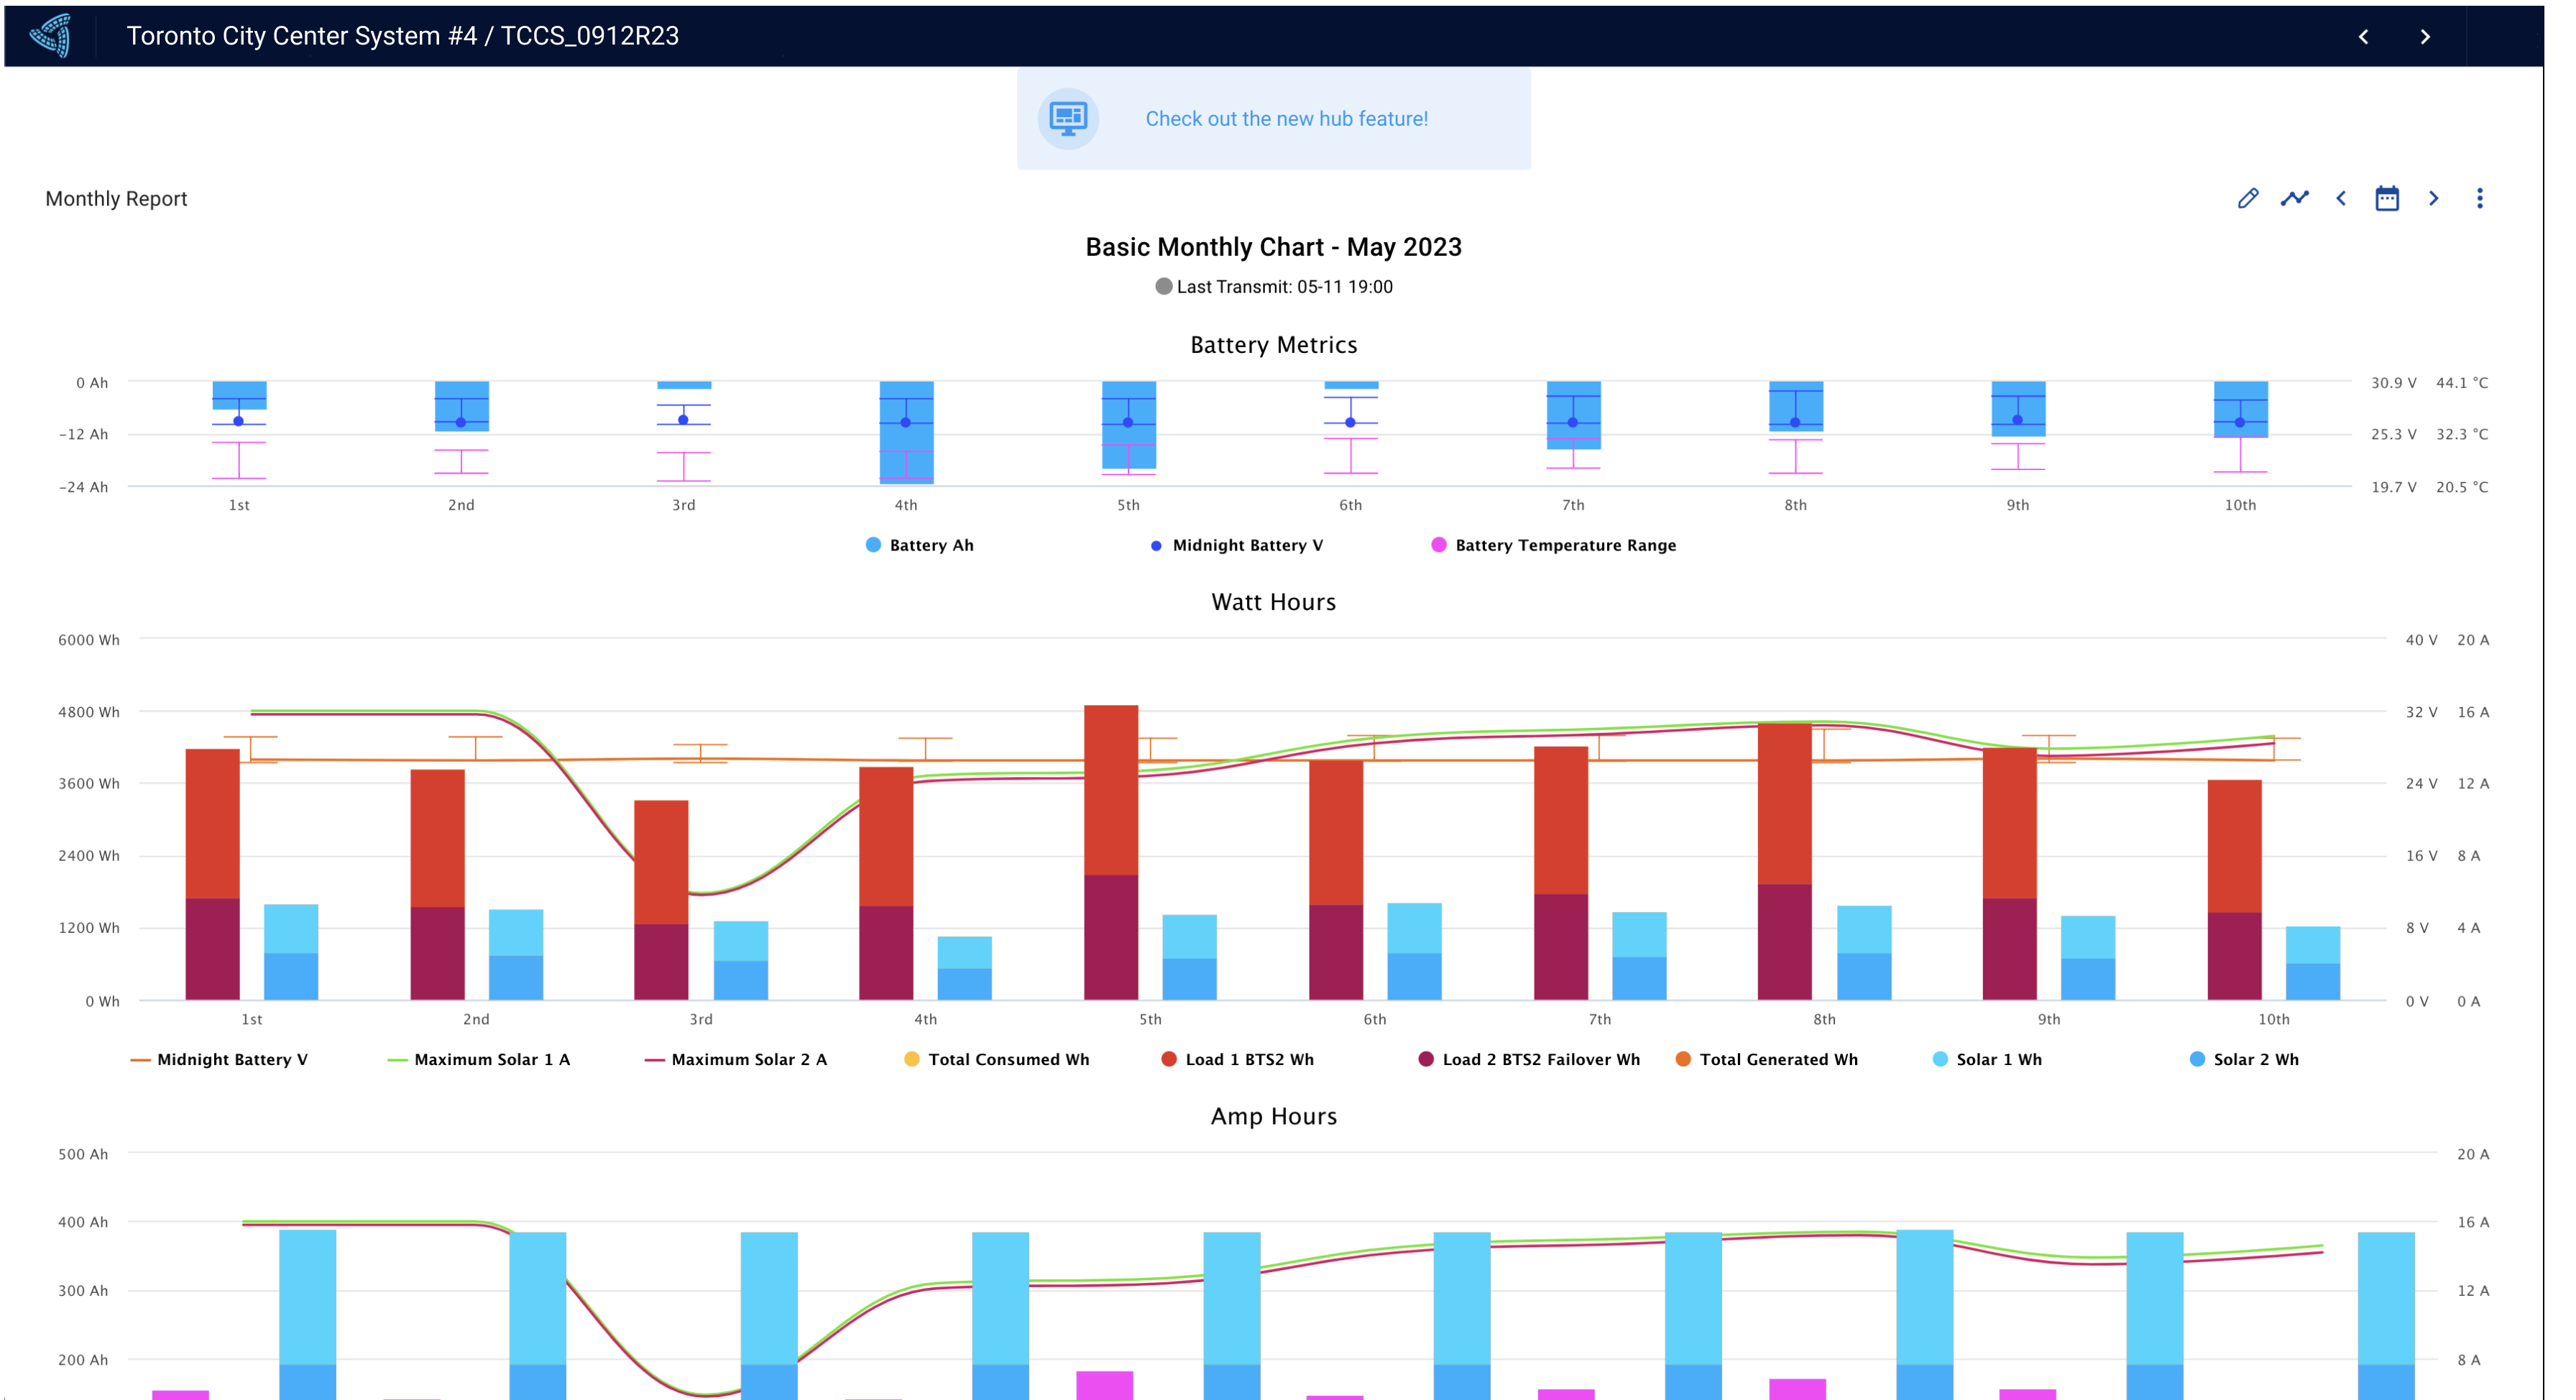
The monthly report shows the systems information by day for that month. By putting the cursor on any particular day, the details for that day are displayed. Monthly reports are often used to analyze battery life, load consumption and energy generation.
The monthly report is split up into three charts: Battery Metrics, Watt Hours and Amp Hours. Battery Metrics shows variables specific to the battery. This chart can be used to analyze the life of the batteries. If the battery is nearing the end of its life it will not retain charge as well and may result in outages. Watt Hours shows the variables specific to the power generation or consumption of the system. This chart can be used to verify the actual consumption of the loads (may differ from load specs) or the energy generation of your solar panels, wind turbines or generators. It can also assist in determining shading on solar panels. Lastly, the Amp Hours shows the variables specific to the capacity of your system. This chart can be used to verify that the size of your system is too big, too small or just right.
Daily Data Report
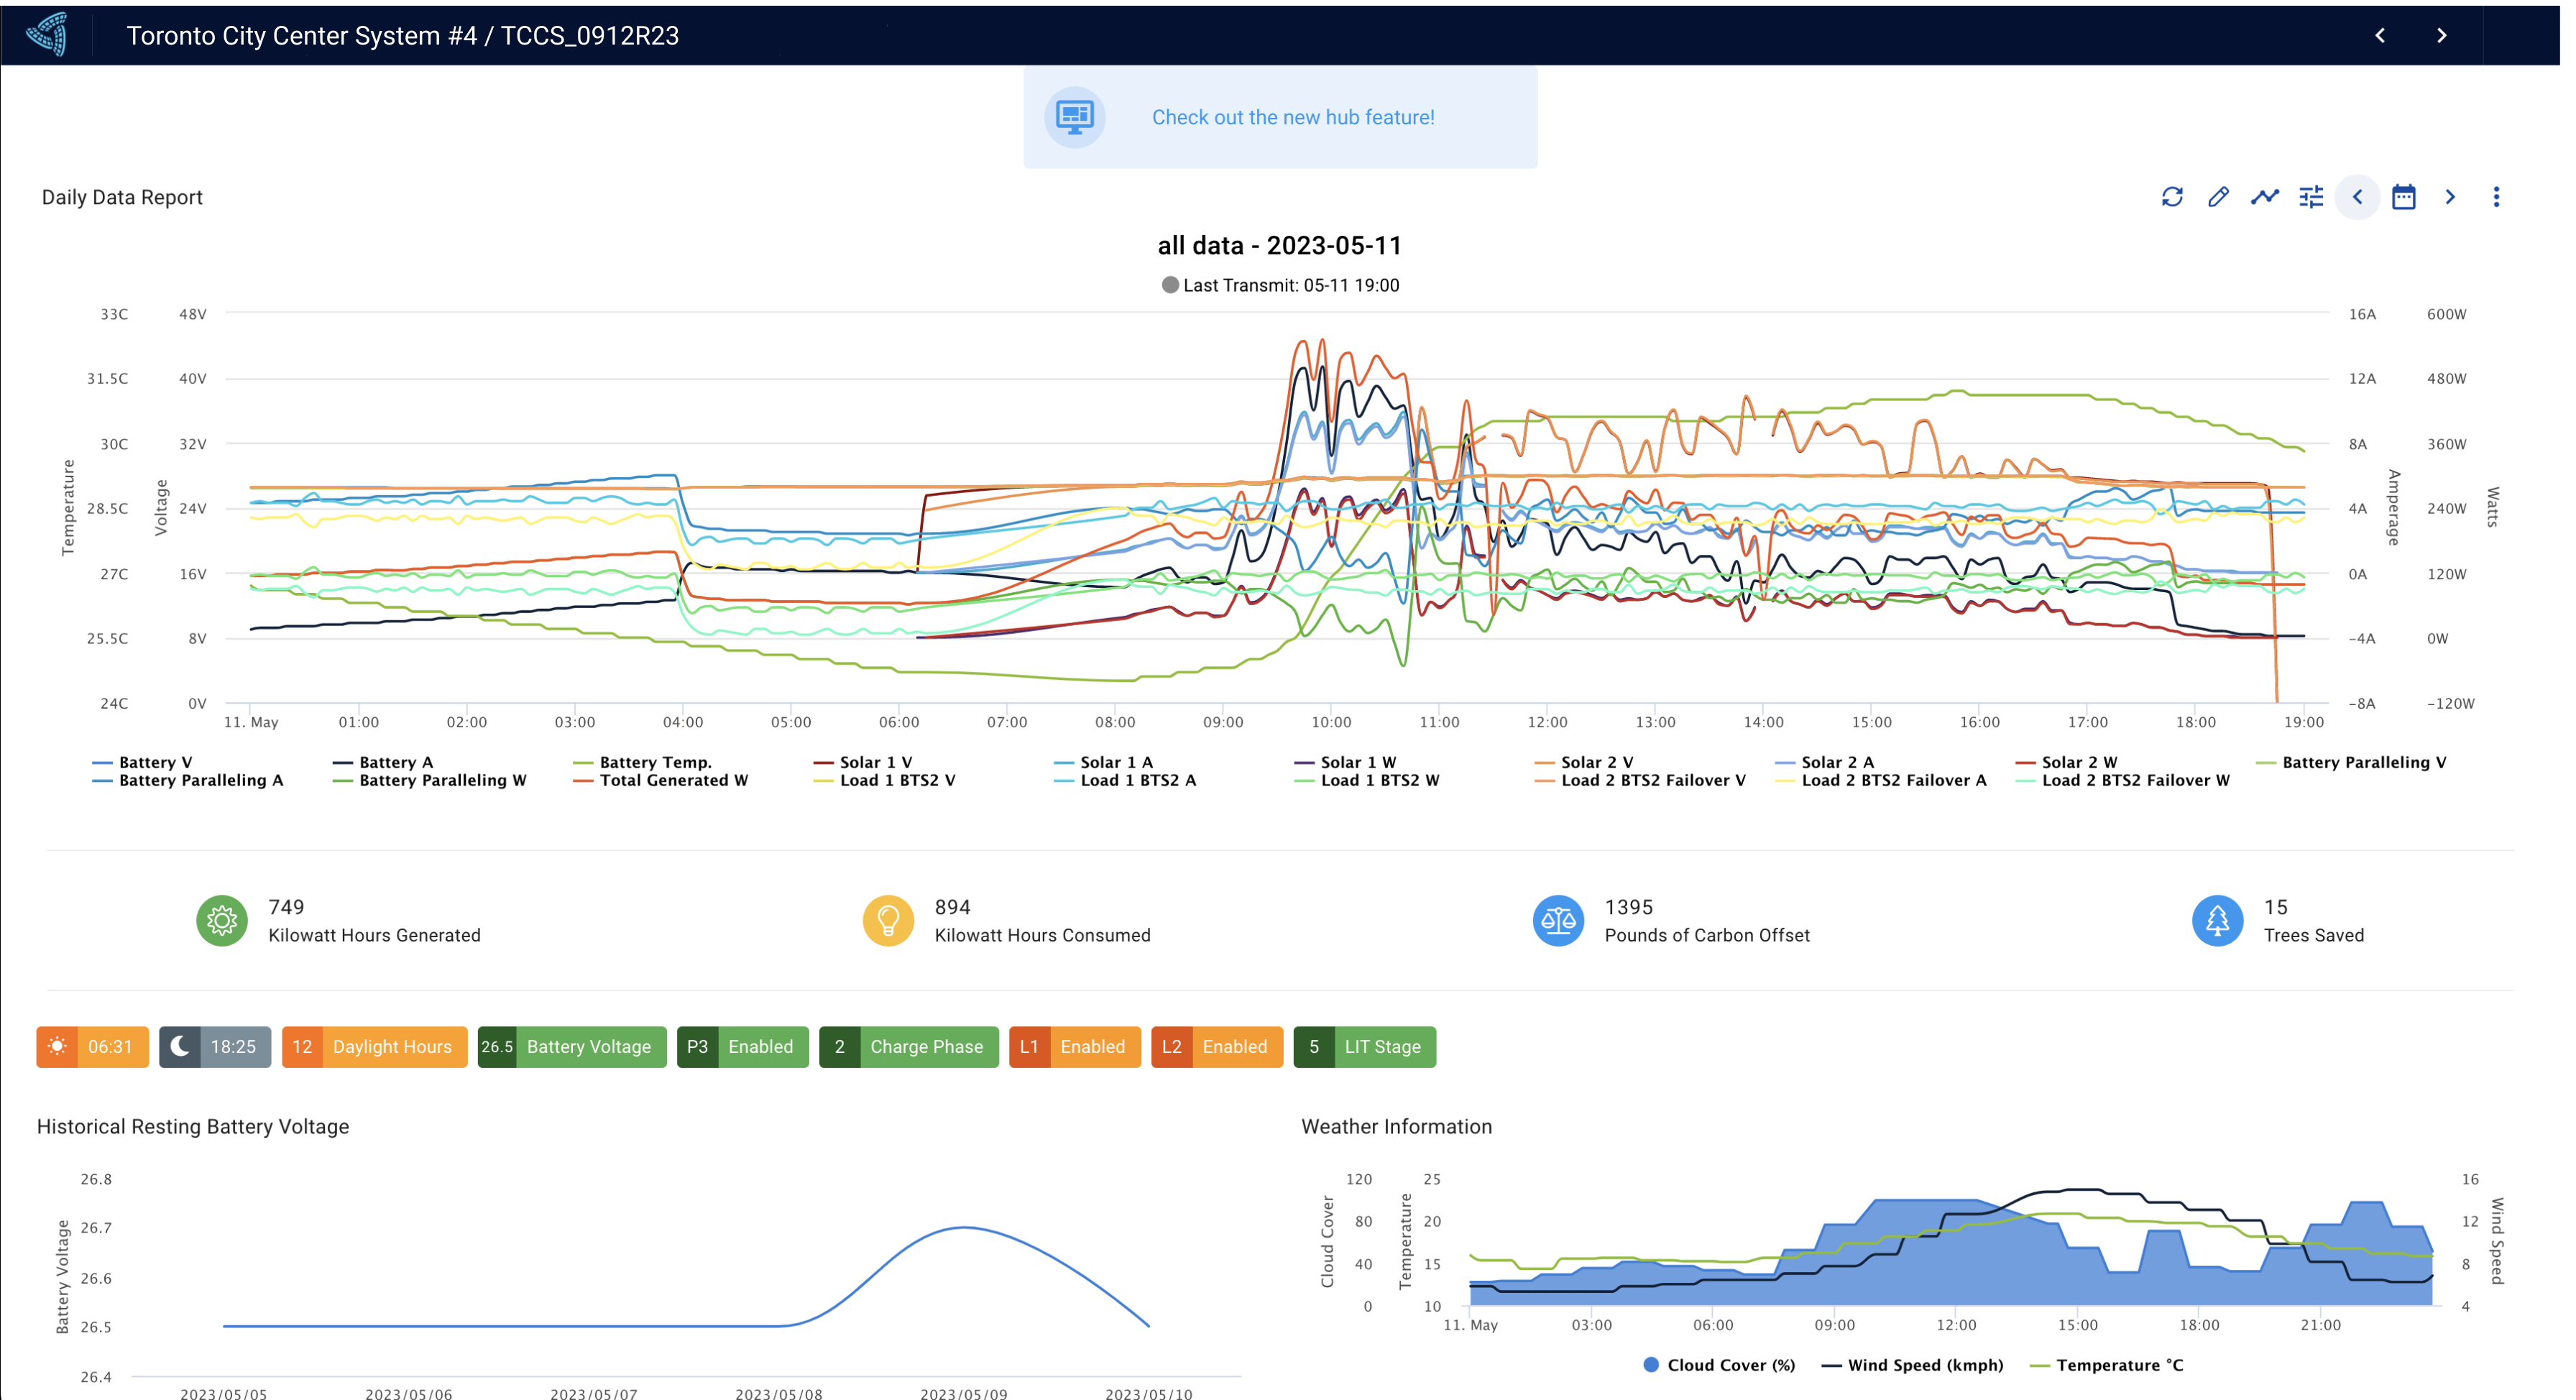
The daily data report shows the data of the last 24hrs starting from midnight. It can also show from dusk-to-dusk or dawn-to-dawn by changing your preferences. This report is used to see how your system is operating on a day-to-day basis. It shows the charge and discharge trend of your system. On the top left is the Historical Resting Battery Voltage where the average battery voltage is tracked for that month. This, along with other data, can be used to analyze the health of the battery. On the top right is the weather information of that day starting from midnight. This is often used to see how sunny or cloudy that day has been, which can help to determine why a system may not be generating a lot of energy.
Detailed Data Report
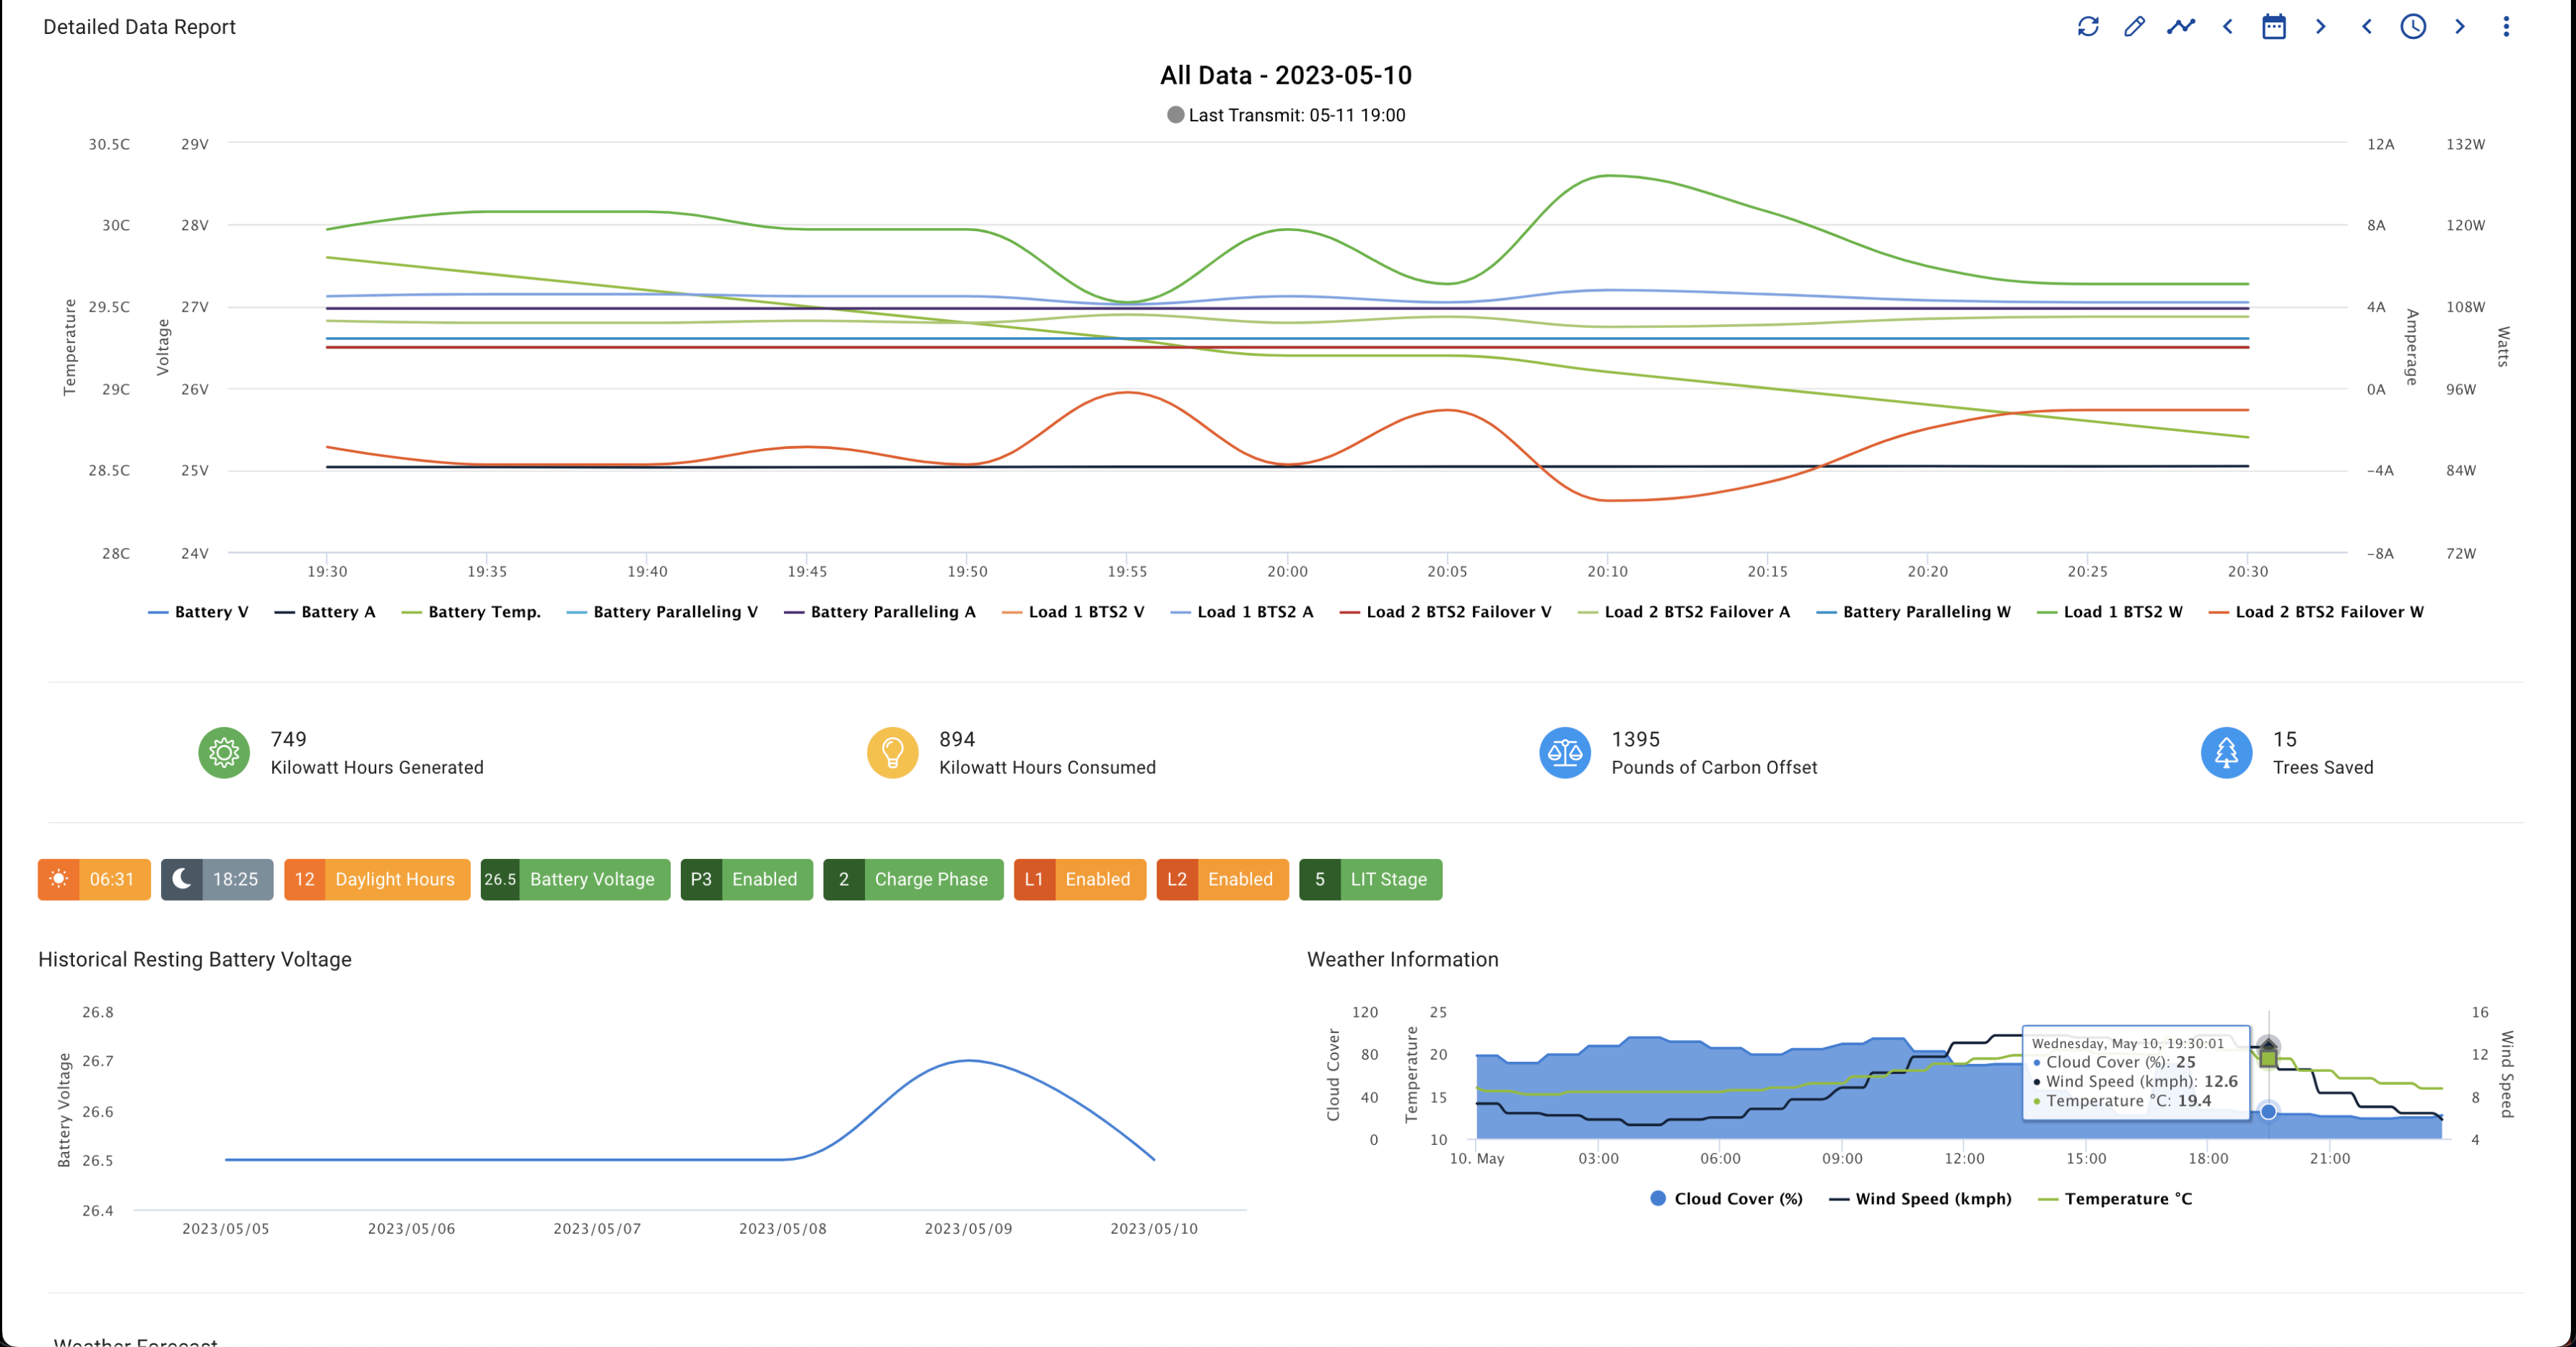
This report is often used to see more granular data of the system. The time window for the detailed data report is hourly. It also has the historical resting battery voltage and weather information similar to the daily data report.
Annual Report
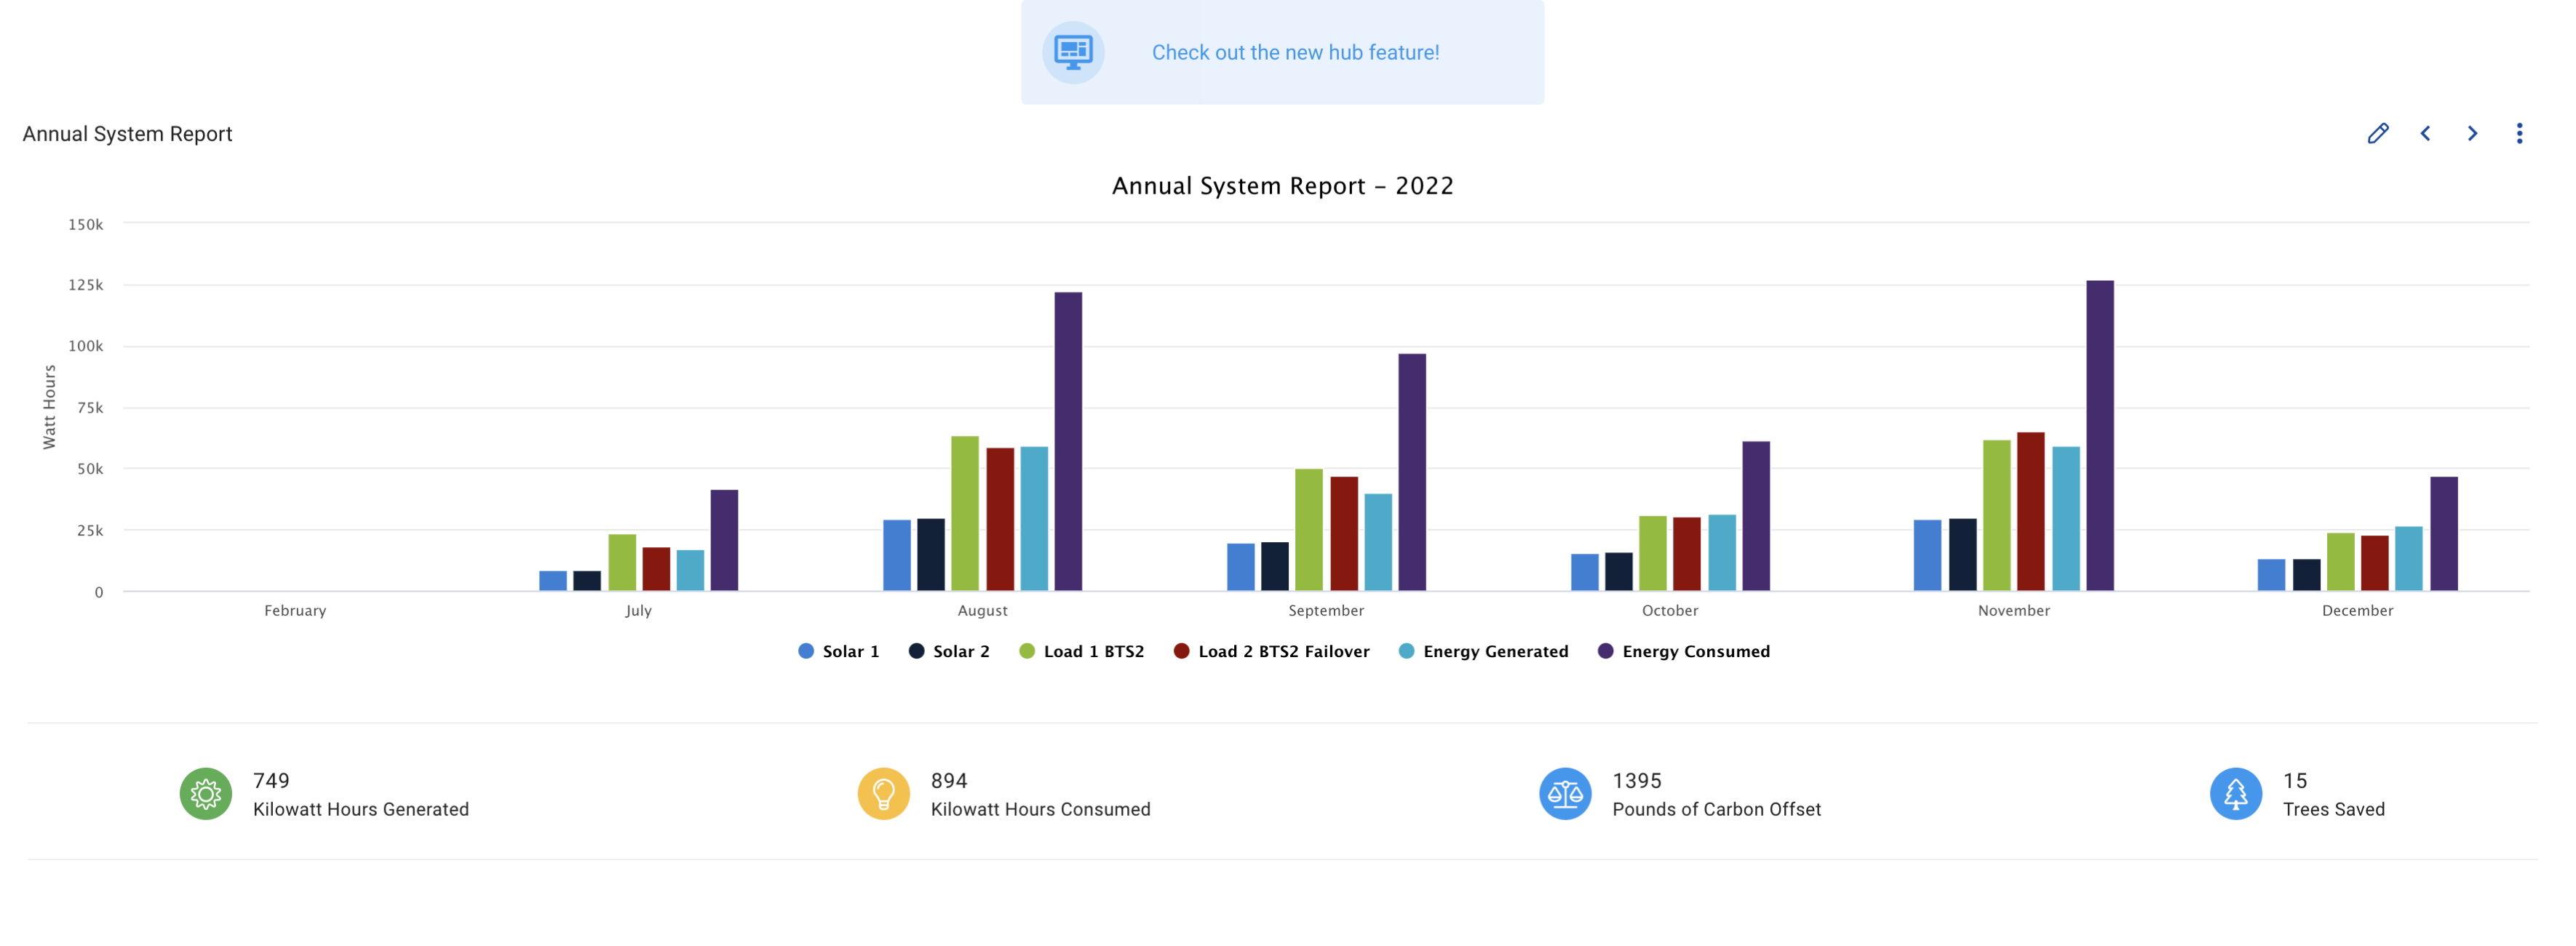
The annual report summarizes the energy consumed or generated per month by the loads and sources. If there are certain months where the solar panels or wind turbines generate more energy than others, or if there are some months where the loads consume more energy than others then it can be tracked here. The total energy generated and consumed is also shown.
Systems that have multiple controllers are called multi-controller systems (MCS). In the list layout
System Reports
The system reports have three charts: system energy, consumed energy and generated energy. These charts can be used to compare how each of the controllers are generating and consuming energy. It is also easy to view how well the system as a whole is generating and consuming energy.
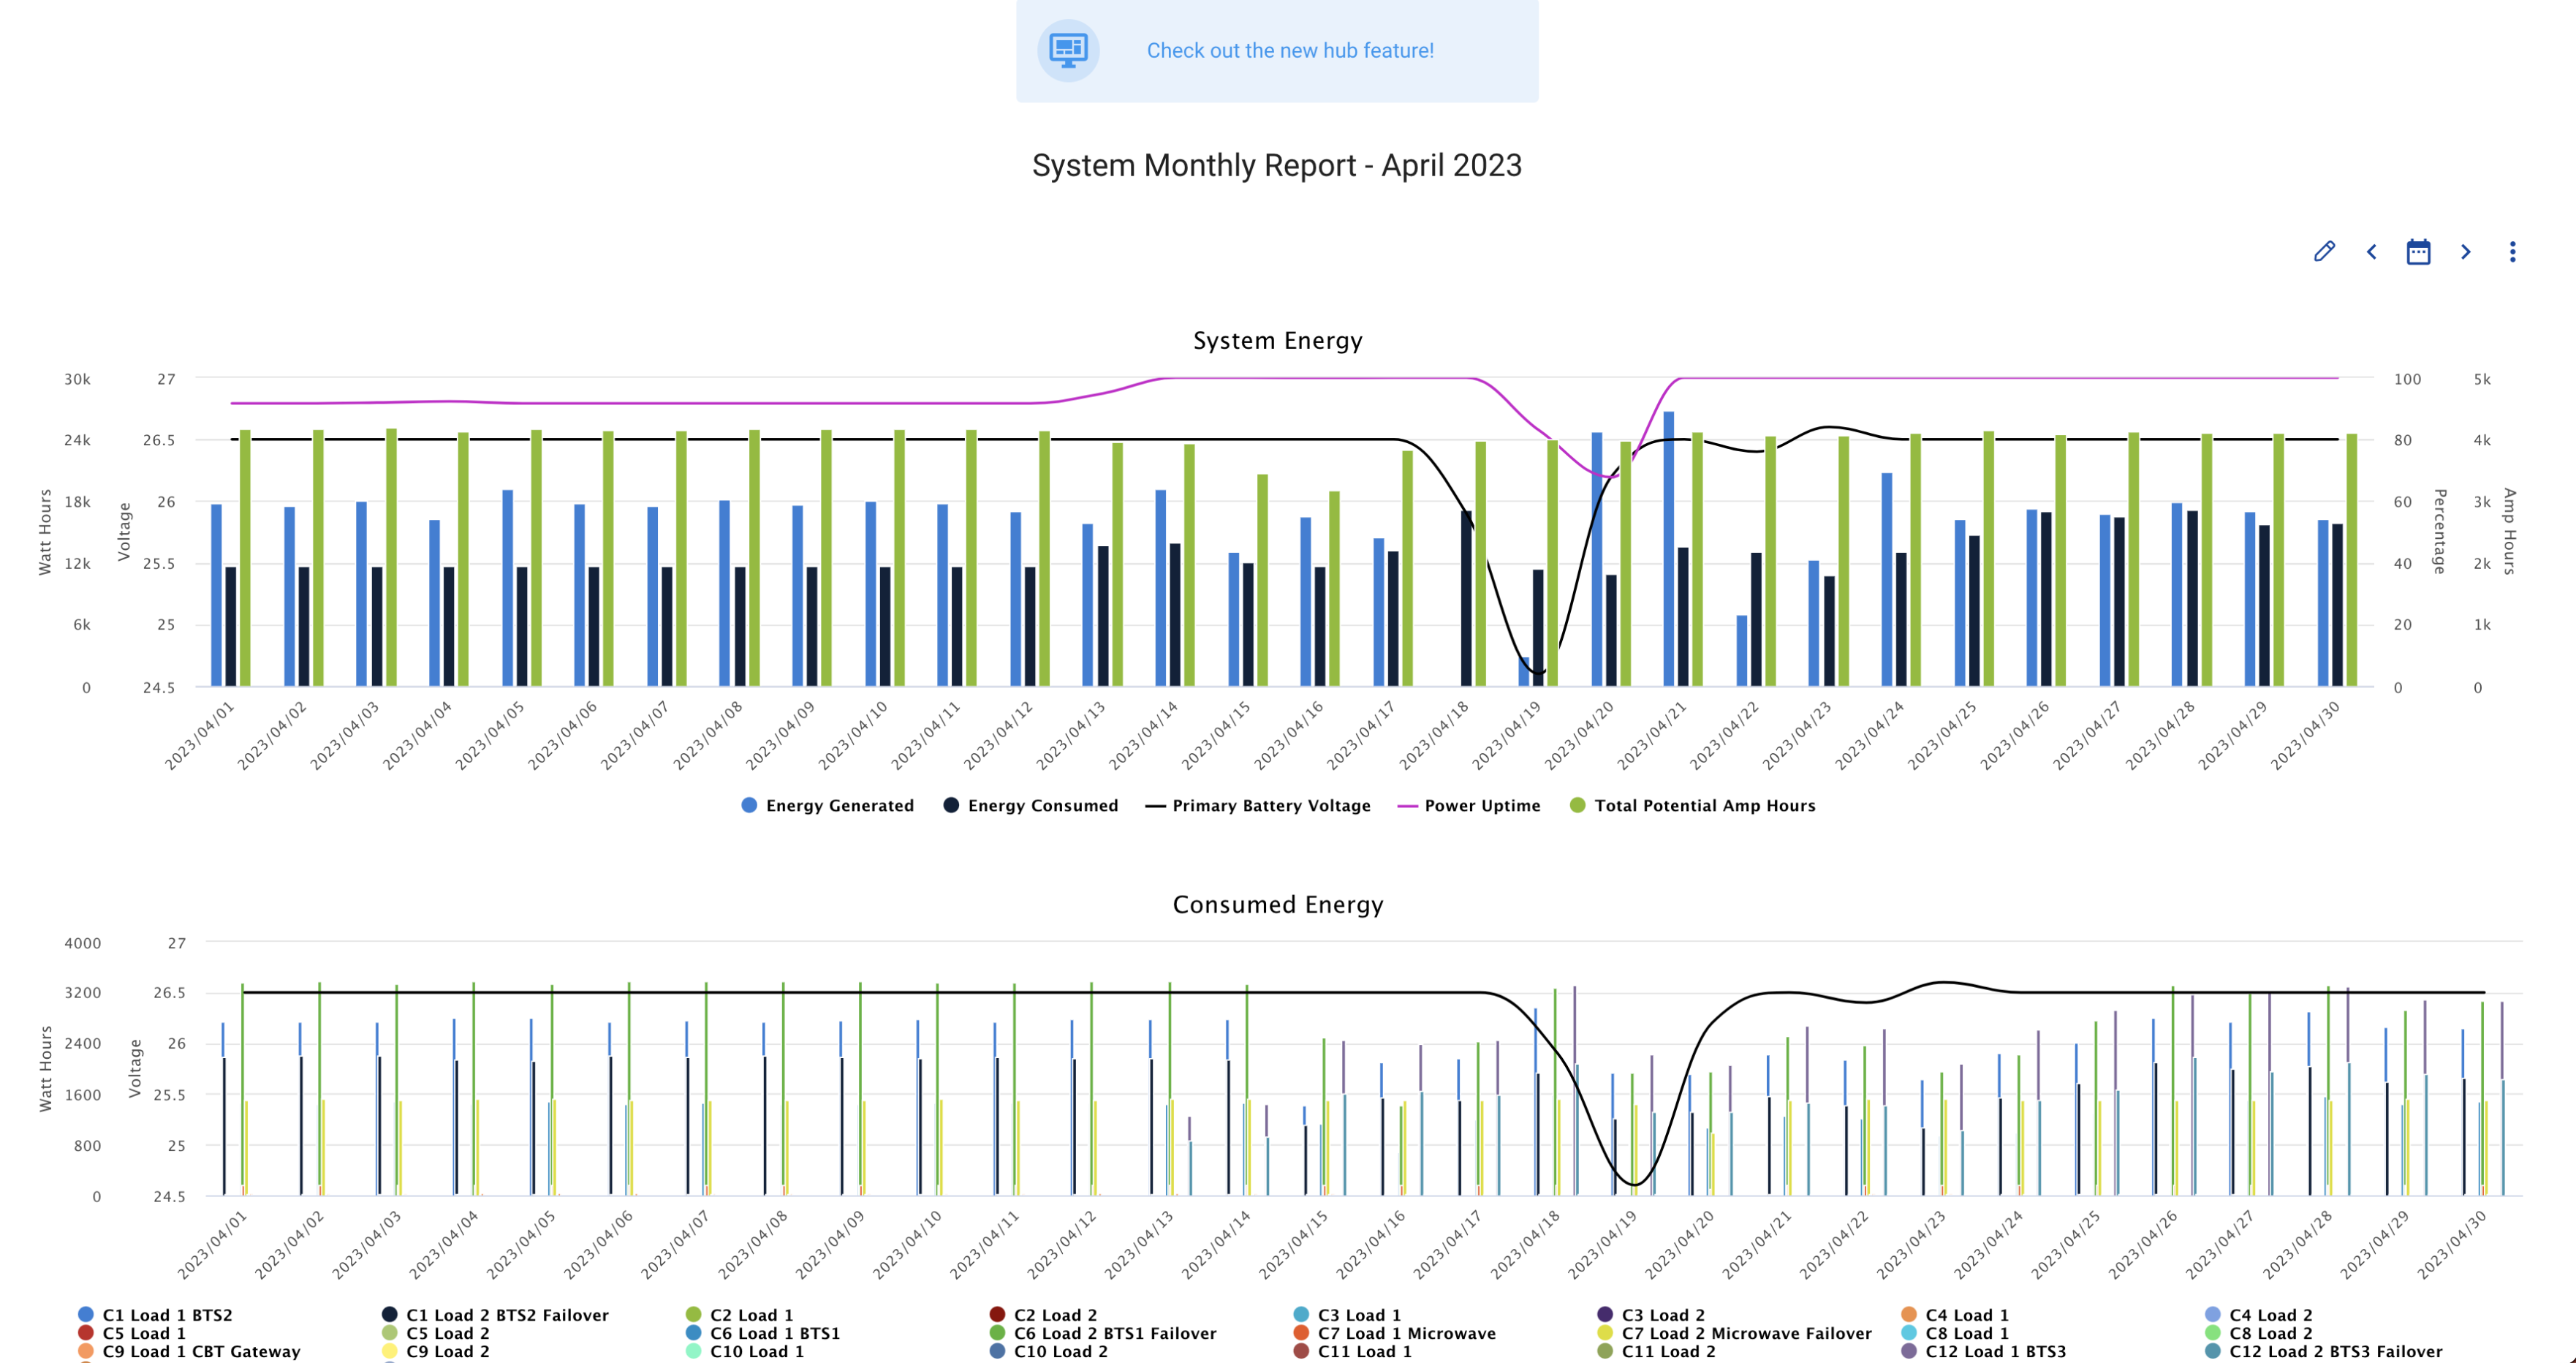
If you click on one of the months, that monthly report will appear.
If you click on one of the days in the monthly report, that daily report will appear.
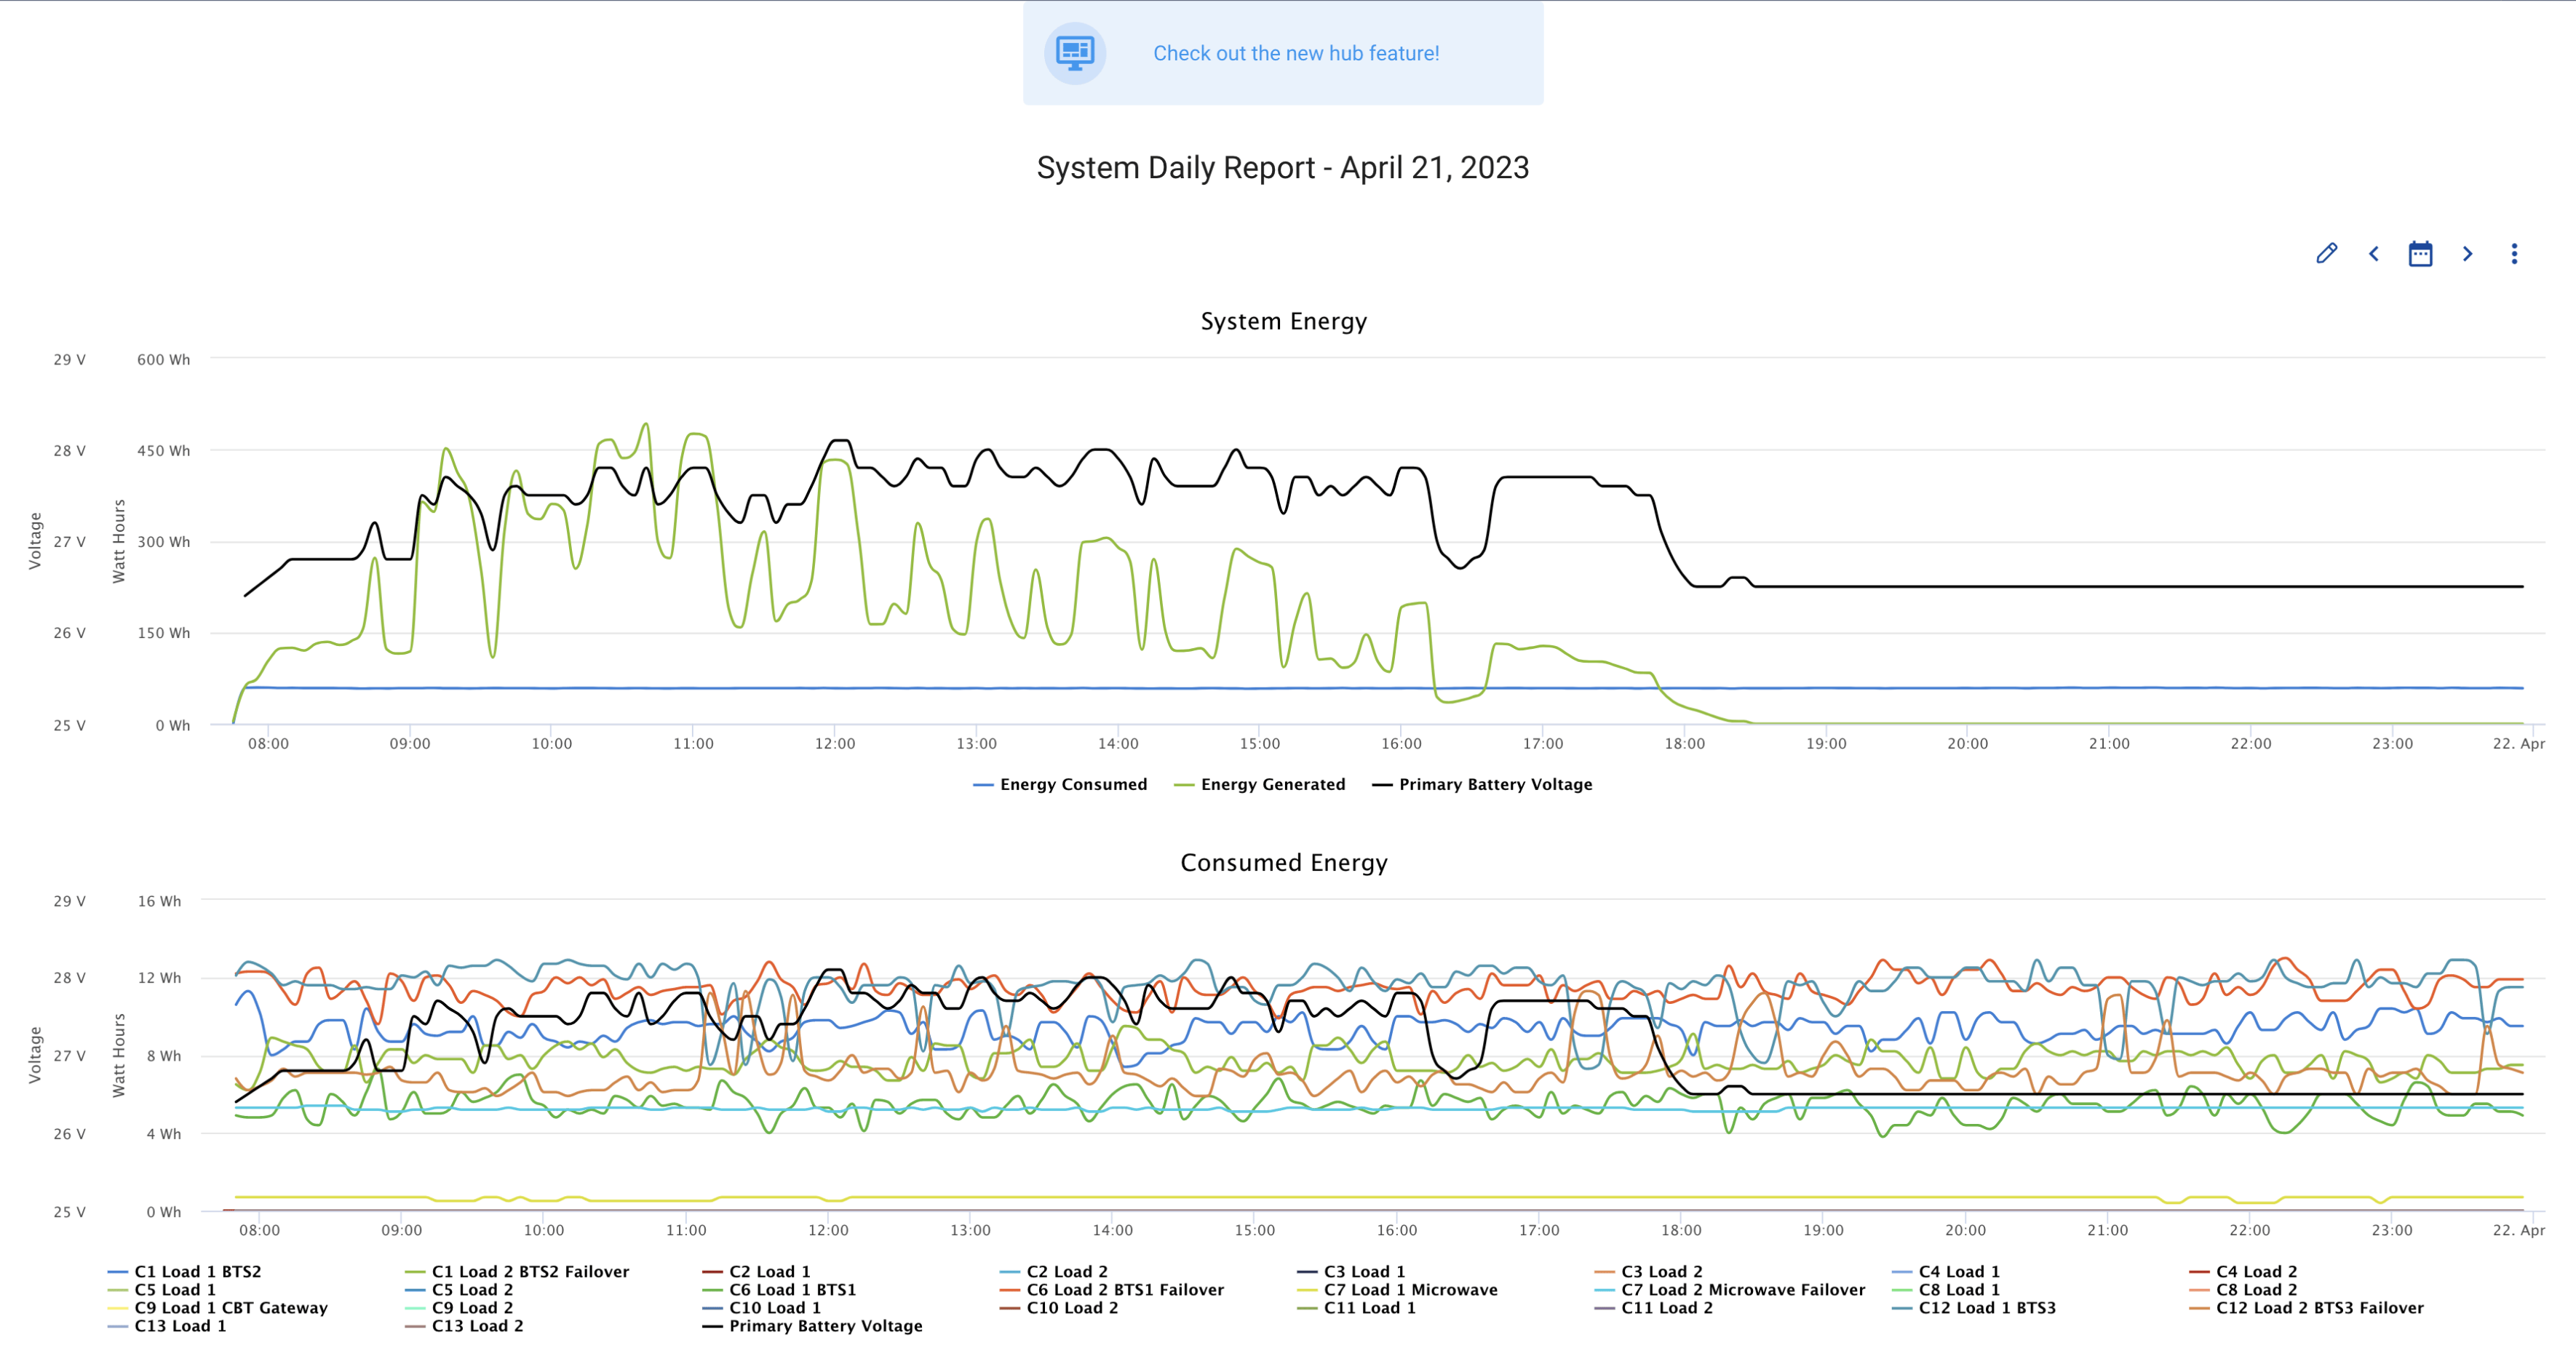
Lastly, if you click on the for a controller on any of the reports, it will pull up the reports for that controller.
Things to Know About Reports
Reading a Report
Every report has an x and y axis. The x-axis lists the time or date (depending on the report). The y-axis are the variables. The y-axis can show up on both the left and the right side of the chart. When the mouse hovers over the chart, it will show a text box with the values of all the data points at that time or date.
By clicking on the variables below the x-axis, it will either show or hide that data on the report. If there are variables that are missing then click on the to select a different chart that would have the variables you are looking for. If there are no charts or if they aren’t the charts you are looking for, then please continue to create a custom chart.
Zoom
You can highlight an area that you wish to view closer as shown below.
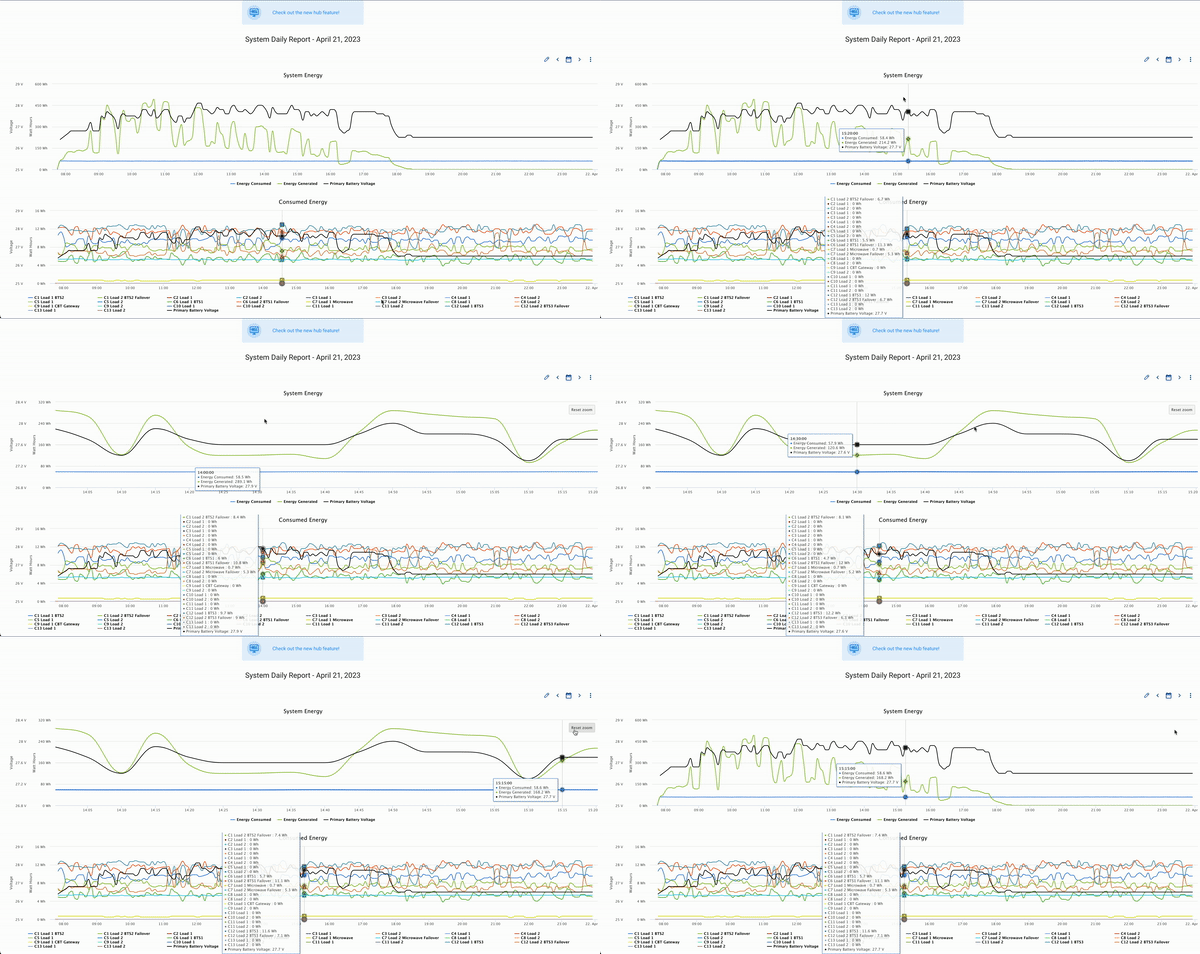
To reset the zoom, press the “reset zoom” button in the top right corner of the chart.
Daily Statistics
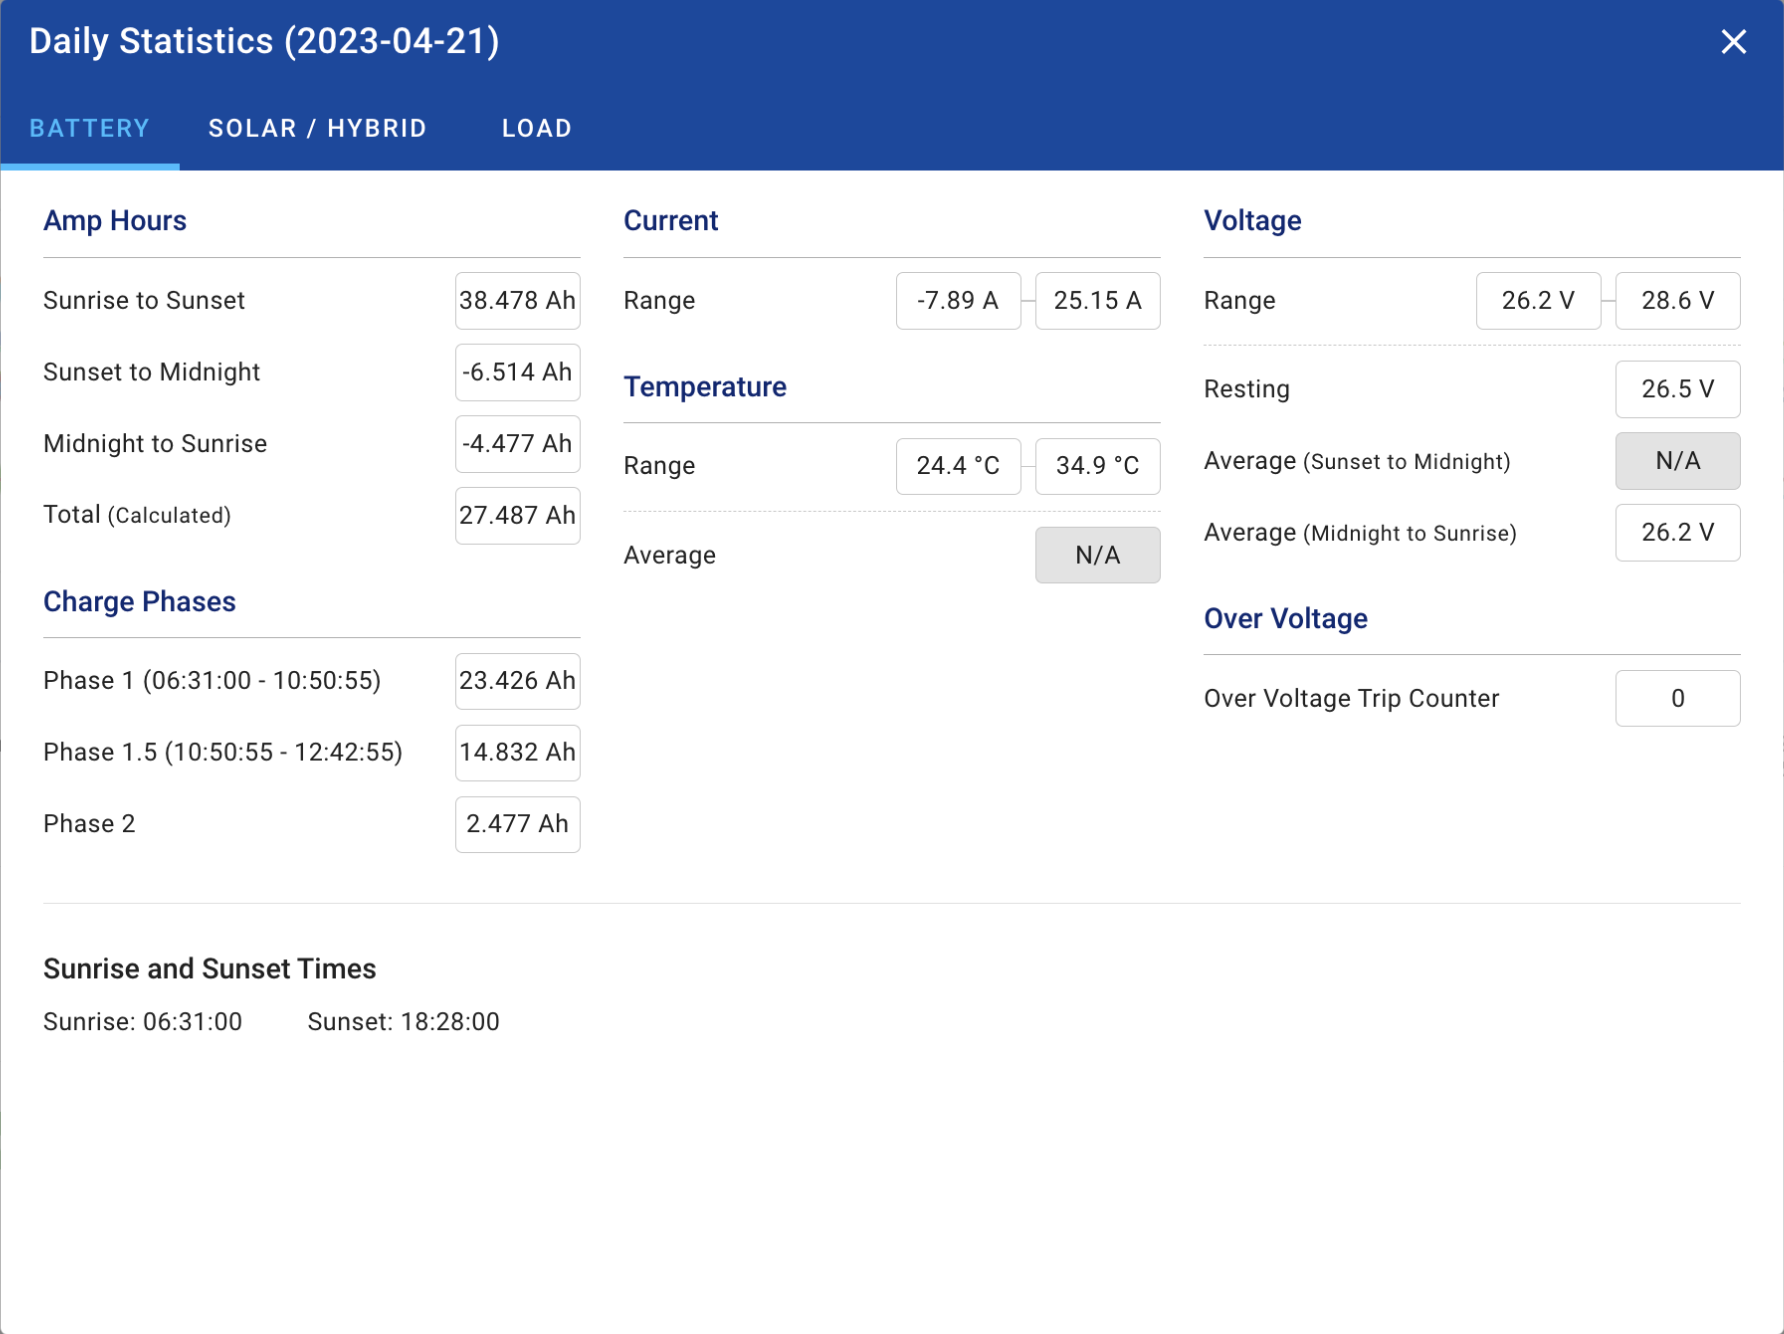
When on a report, you can view the systems daily statistics by selecting the option from the . There are three panels: battery, solar/hybrid and load. Each panel will vary depending on the system configuration. The daily statistics page summarizes the averages and/or maximums and minimums of various values of that day. For the battery daily statistics, amp hours throughout various times of the day, current range, voltage range, resting voltage, voltage averages, amp hours collected during the charge phases and temperature range/average are listed.
Solar/hybrid statistics show values such as amp hours, current, wind speed (average and maximum), voltage range and total watt hours collected that day.
The load daily statistics show the summation of amp hours of each load (in this case just Load 1) for various times during the day. It also shows the range of current and voltage of the load, as well as the total watt hours that were consumed that day.
If some statistics do not apply then N/A will be shown. Lastly, if you you see an eraser icon beside the date then that indicates an erase occurred on the device which affects that accuracy in the amp-hour summations and averages.
Creating a Custom Chart
You can create your own customer charts for each type of report by clicking on the and select “Add Custom Chart”.
If you click on the downward arrow, a list of metrics for each category will be shown. The options of metrics changes depending on the report. By selecting the + it will add those metrics to “Your Selections” tab on the right. Once you are done selecting your metrics, press save and name your chart. Lastly, you can also make this custom chart your default chart when you open that report by selecting “Make This My Default Chart.”
Weather Forecasting
At the bottom of all reports it shows the weather forecast of the next five days. Above the weather forecasting is the energy generated, energy consumed, pounds of carbon offset and the number of trees you have saved.