System Monthly Report (Export Data)
ℹ️ Only for Nano-Grid Systems.
System Report
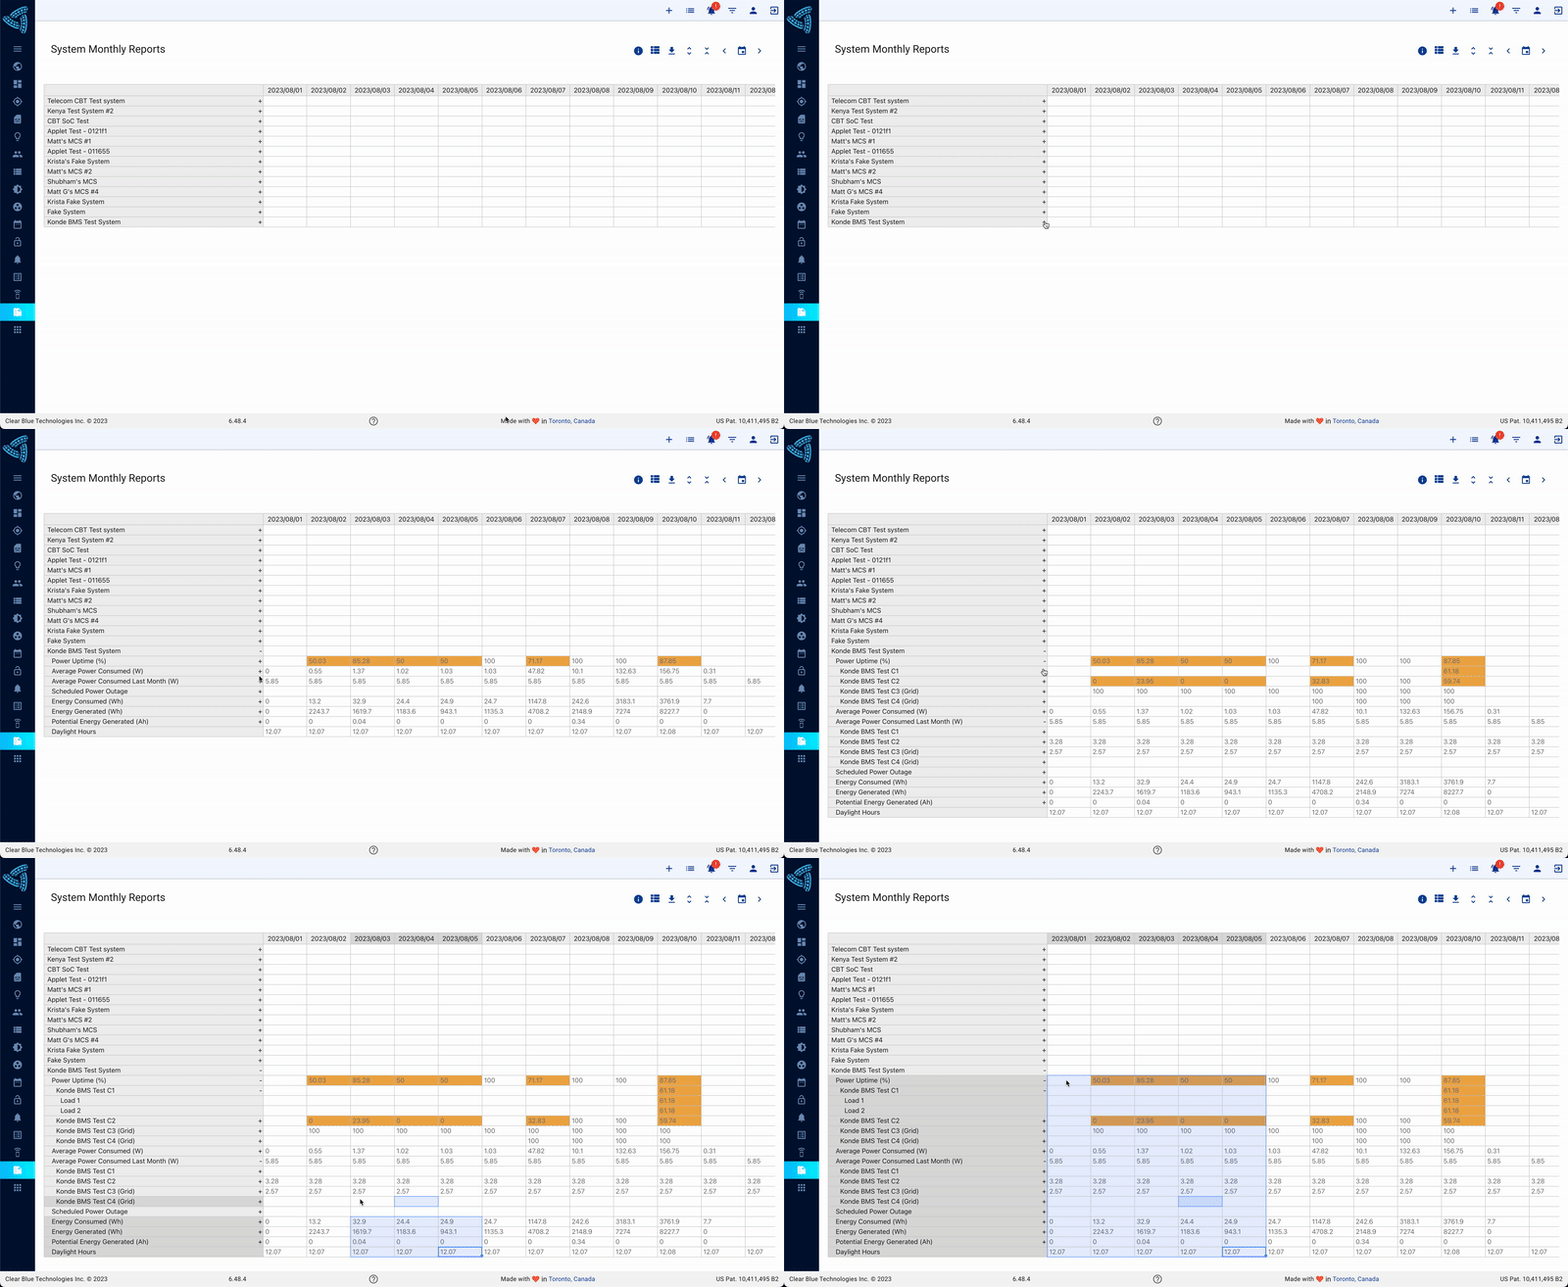
In addition to the MCS reports, you can also access aggregated system data through the System Report. This data is aggregated at a system level and the report displays it for all of your systems on one page in a table format. This data is also exportable to a CSV file. To access the system report, click on the report icon shown in the green border on the left bar. This will bring you your system report page.
The table shown lists all of your systems that are not in maintenance or commissioning mode, with a column for every day of that month. By clicking on the + at the end of the first column, you can expand each system to list all of the data for that system.
To change the month, click on the calendar icon and select the desired month.
System Report Data
The data displayed on the system report includes the following:
Power Uptime (%): This is the percentage of time that the load was enabled versus the total length of time the load was expected to be enabled. The length of time the load is expected to be enabled is determined by its load profile settings and scheduled events. The length of time the load was actually enabled is determined by critical faults such as short circuits, output overloads, and low voltage disconnects. Values less than 98% will be highlighted orange to signify that the power uptime is low and the system may need attention. This can only be calculated with software versions 5.37.0.0 or higher. To confirm if your system can calculate this information, please see the software version of your system on the table view on the system chooser under the “Controller” column or contact the Clear Blue support team.
Average Power Consumed (W): This value is calculated by dividing the energy consumed (Wh) by 24hrs.
Average Power Consumed Last Month (W): This is last month's average consumed power. It can be used to compare how much the power consumption has changed since last month.
Scheduled Power Outage: Determines if an event was scheduled to disable a load. Scheduled power outages are used to better manage consumption and provide optimal power uptime. This can only be calculated with software versions 5.37.0.0 or higher. To confirm if your system can calculate this information, please see the software version of your system on the table view on the system chooser under the “Controller” column or contact the Clear Blue support team.
Energy Consumed (Wh): Total consumed energy. This data can also be found on the monthly charts.
Energy Generated (Wh): Total generated energy. This data can also be found on the monthly charts.
Potential Energy Generated (Ah): The maximum energy that could have been generated by the system’s solar input. Potential energy must be enabled on the system for this value to be calculated. Please contact the Clear Blue support team to see if this feature is enabled on your system.
Daylight Hours: Number of hours between sunrise and sunset that day.
Depending on the data, you can further expand by clicking on the + to show the data per controller and per port, where applicable, as shown in the green border.
For future reference, you can click on the information icon to review information regarding the power uptime (%), scheduled power outage, potential energy generated (Ah) and daylight hours.
Exporting Data
You can view this data outside of Illumience through two methods. The first is by highlighting the specific data you want, then copying and pasting it into an external application such as excel.
The second is by exporting the data to a CSV file by clicking on the download icon. This will export all data that is currently visible on the screen. To export all the data for all the systems easily, you can expand all rows by clicking the expand icon and then exporting the data as per the previous instructions. To then collapse all the rows, click the collapse icon. To export some of the data then expand the rows to display whatever data you are interested in.