Main Dashboard
The main dashboard is your control center for managing your systems. It gives you an overview of system performance and quick access to critical management functions, empowering you to monitor and optimize efficiency with ease.
It includes the system chooser, top bar, left bar and the system overview statistic summary.
System Chooser
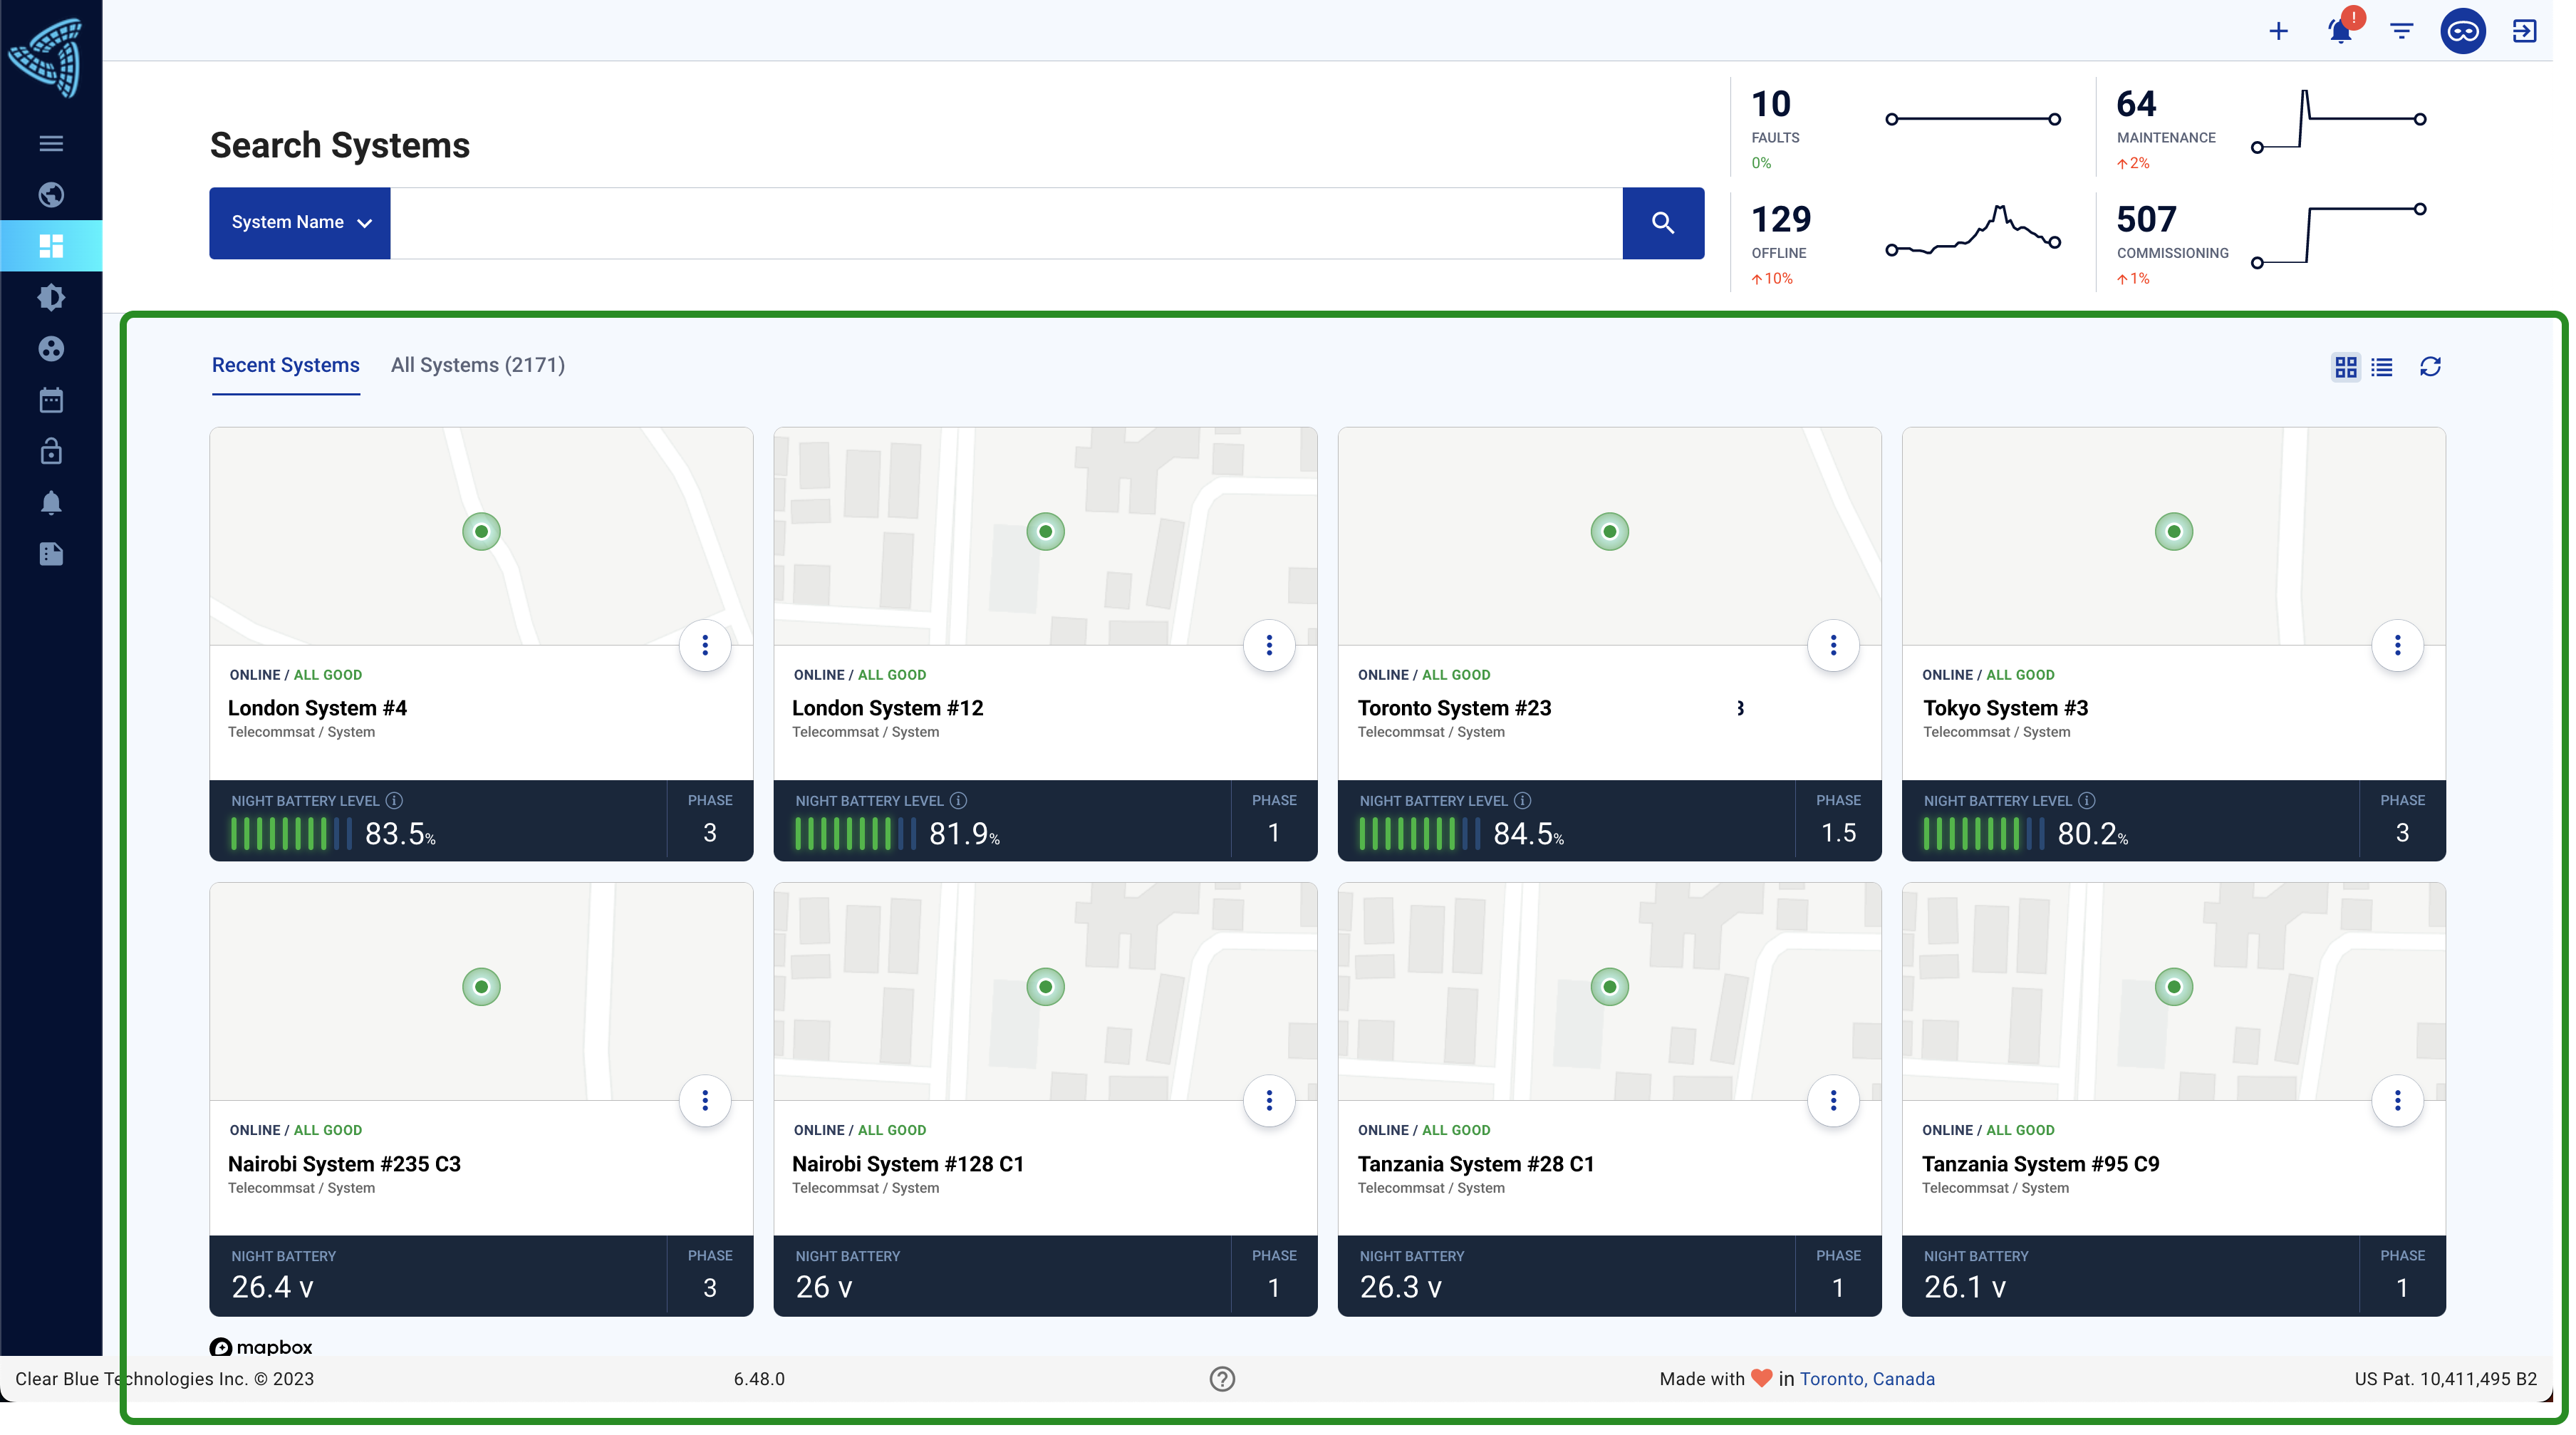
The system chooser allows you to view your system in a variety of ways depending on your preferences.
Grid Layout provides a succinct summary of key system data and is beneficial for individuals seeking a quick update of the energy status. beneficial for individuals seeking a concise update on the system's energy status.
The Map offers system data in a geographical perspective, making it highly valuable for individuals managing systems spread across expansive areas. It presents similar information as the grid layout but in a visually intuitive way, allowing users to conveniently assess the energy status based on geographic locations.
List Layout presents a wealth of detailed data about your systems including comprehensive information on system specifics, energy status, and fault detection.
Default view can be changed in your preferences.
Top Bar
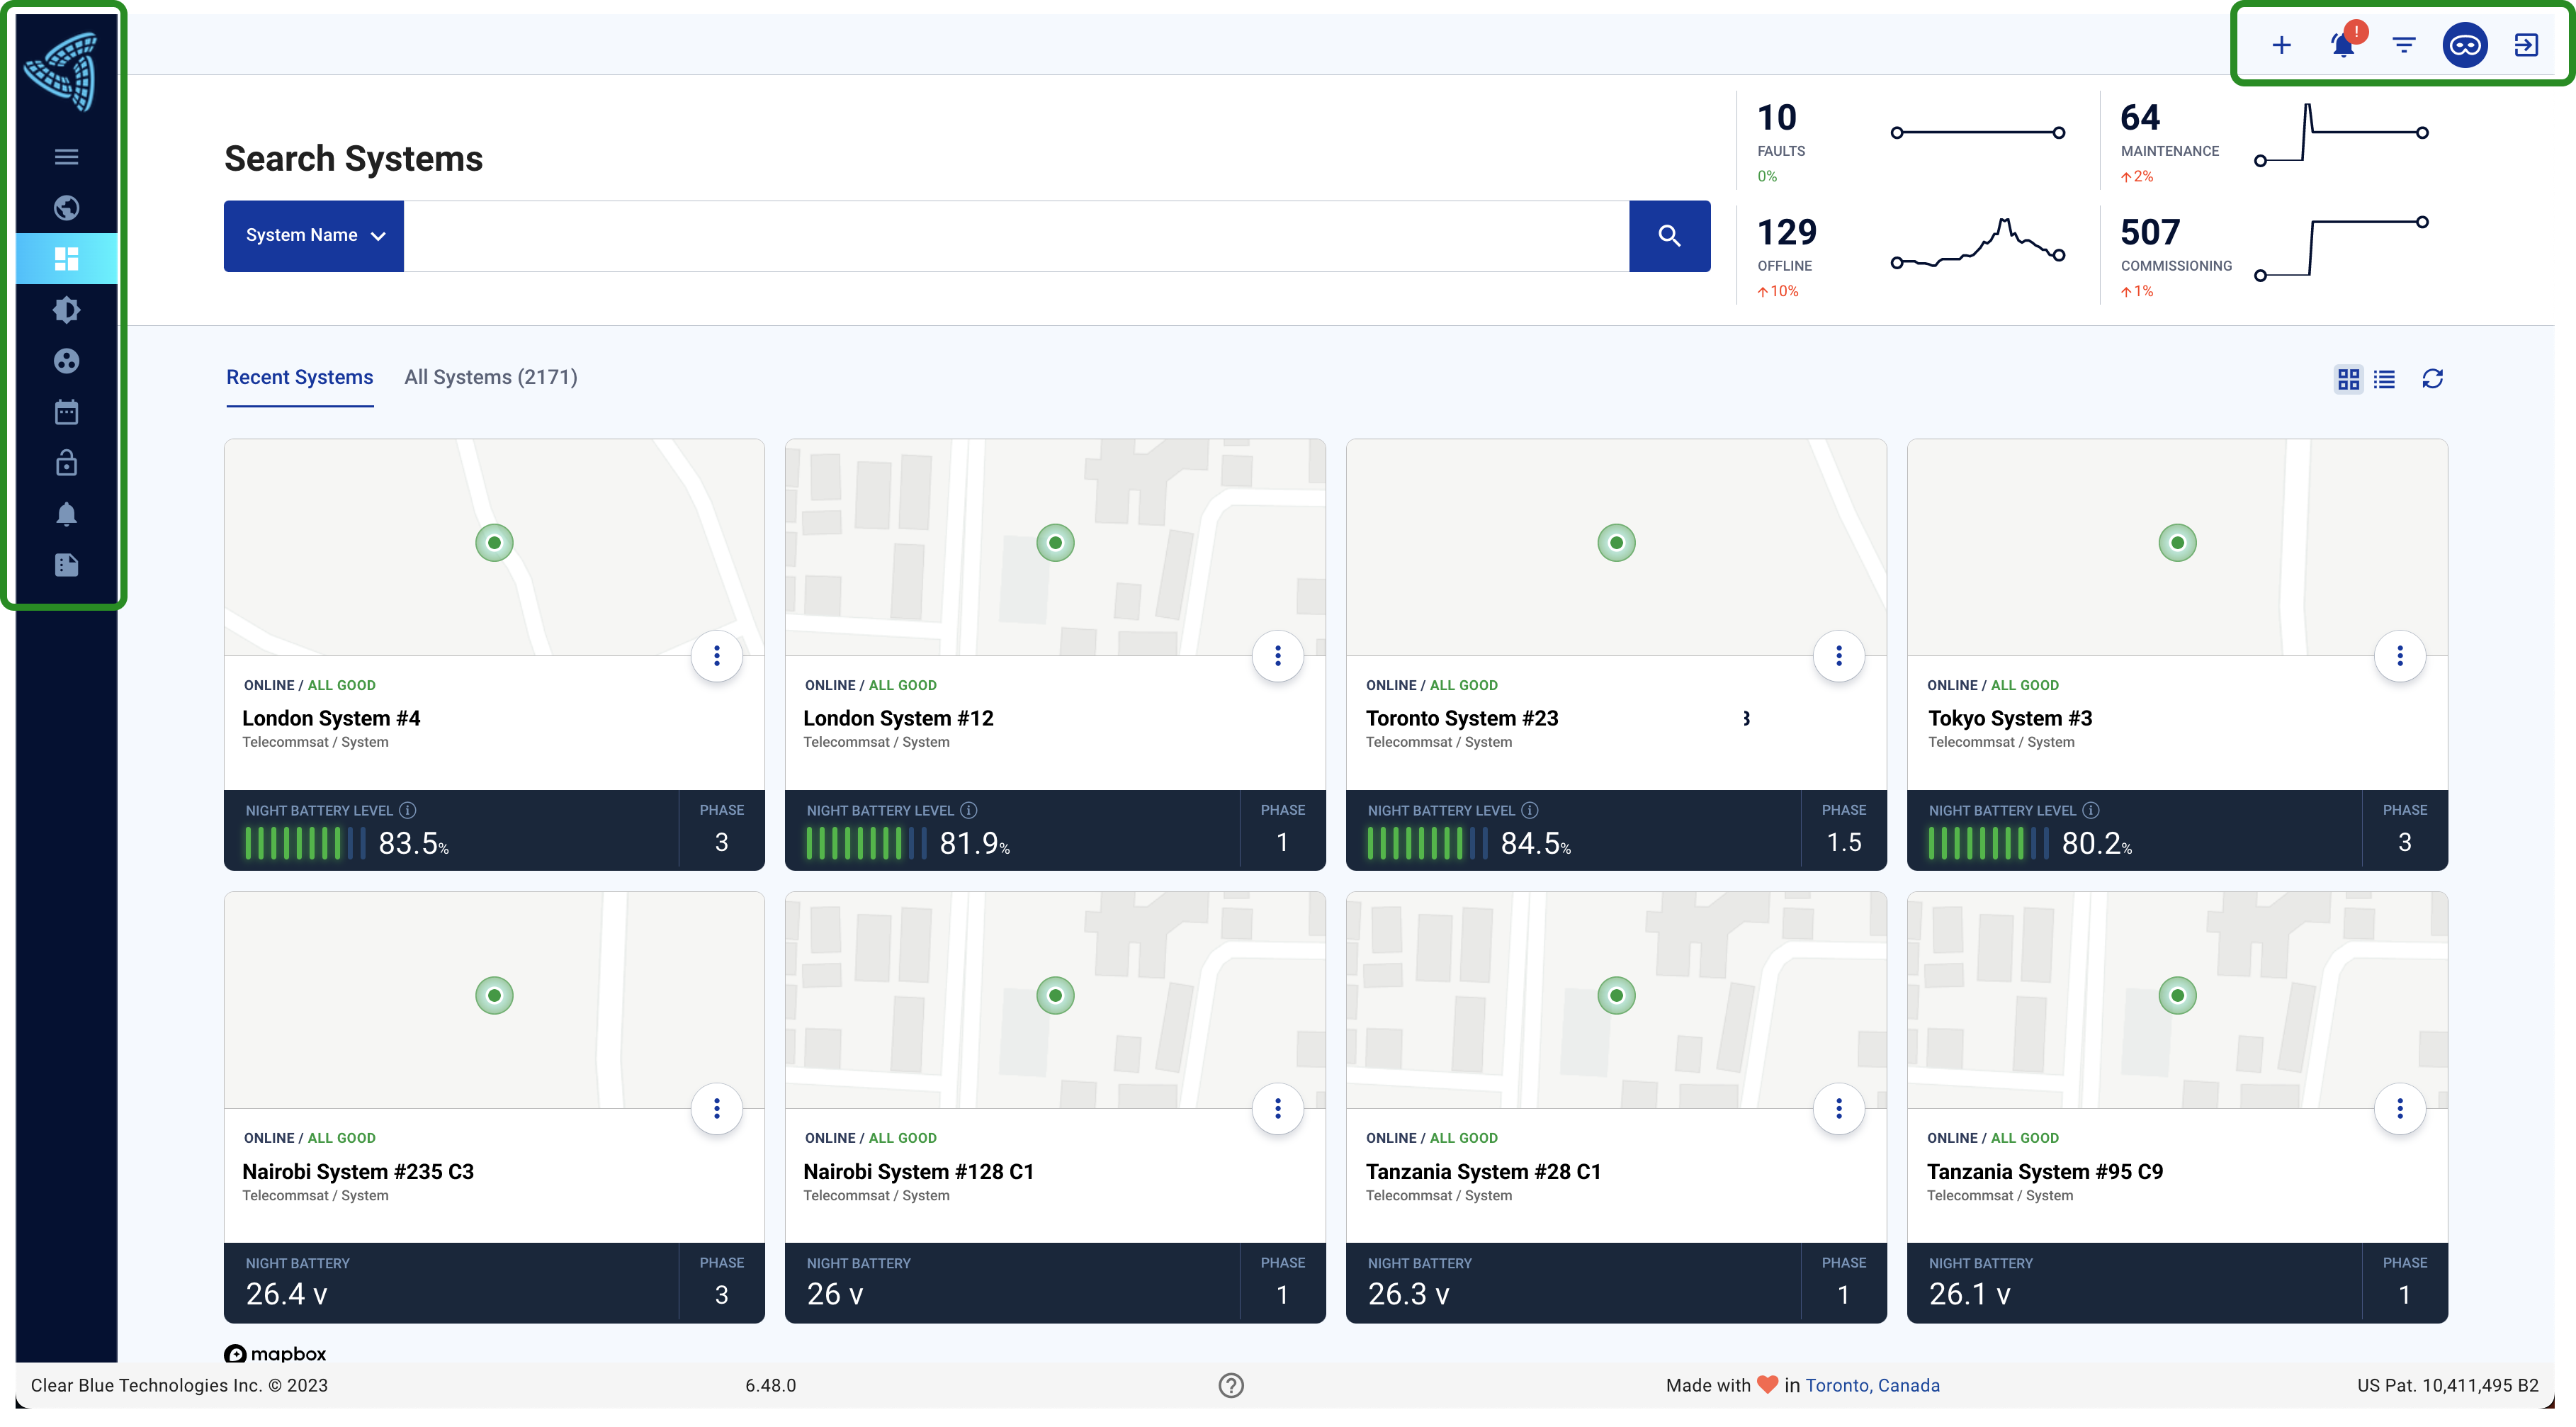
Depending on your permissions you may see different icons and menu options on both the top and side bars. Menu options on the Top Bar can include the following:
 Enables a you to add new items such as public profiles, groups, and alarms. Public profiles are used to configure loads. Groups are created so you can find your systems more easily. Lastly, alerts can be configured by users to receive more up-to-date information on the systems.
 Provides a list of the statuses of your systems that will filter your systems accordingly. These statuses include faults, in commissioning, not in commissioning, offline and in maintenance.
 Enables you to create filters that can be saved and used to search with. Users can filter by customer, network or location.
 Enables you to bring up user preferences. Preferences include language selection, home page default, enabling dark mode and so much more!
 Log out.
Left Bar
Depending on the user permissions the menu options on the Left Bar may include the following:
 The menu options on the left bar can be expanded to show menu names or can be left retracted to show just icons. Click on this icon to expand and retract the menu options.
 Shows you the map. This will display all of your systems according to their GPS coordinates. The systems are also colour coded according to their status.
 Takes you to the main dashboard. Here you can search for your systems, view your statistical summaries and view the status of your systems.
 Takes you to the public profiles. Profiles are used to configure your light for Illumient systems. Here you can view and edit all of your public profiles.
 Takes you to their groups where they can be viewed or updated.
 Lists the monthly reports where you can view the reports of all of their Illumient systems.
 Takes a you to the provisioning page. The provisioning tool is used during installations and maintenance visits. This page allows the admin users of those systems to provide access to the provisioning tool for non-admin users.
 This is the alert control center where users can configure what events they want to be notified for.
System Overview Statistic Summary
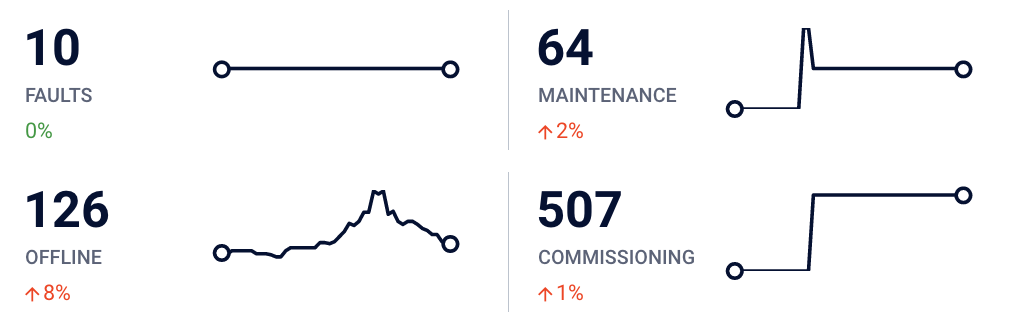
Statistics summarizing the current status of your systems can be found in the top right hand corner of the system chooser page to show the change in status of your systems for the last 24 hours. These graphs update every 30 minutes. The graphs include the following:
Faults
Systems with service interruptions (ie. short circuits, load disconnects due to low voltage).
Maintenance
Systems that require or are undergoing maintenance.
Offline
Systems that are not connected to Illumience. This may be a momentary disconnection due to network issues, or could be a sign of a wider communication issue. If that is the case please reach out to the Clear Blue support team. Your Smart Off-Grid controller is able to perform its function without connectivity to the cloud. So if it is offline, the controller will still manage loads and charging. However, you will be unable to review the system performance in Illumience and update the system configuration until communication is rest
Commissioning
Systems that have been marked to alert users via email when they first communicate with Illumience. This is useful for tracking installation progress, especially in large sites with many systems.
When you click on one of the graphs it will show a list of the systems. This list shows the same information as the table layout mentioned earlier except it is only for the specific systems have been selected.
Search for Systems
There are many ways to search for your systems. This includes the general search, filters and refined results.
General Search

With general search you are able to search using various options as shown below. This tool helps you search faster so that you can view your systems more easily. Search options include:
Search Options
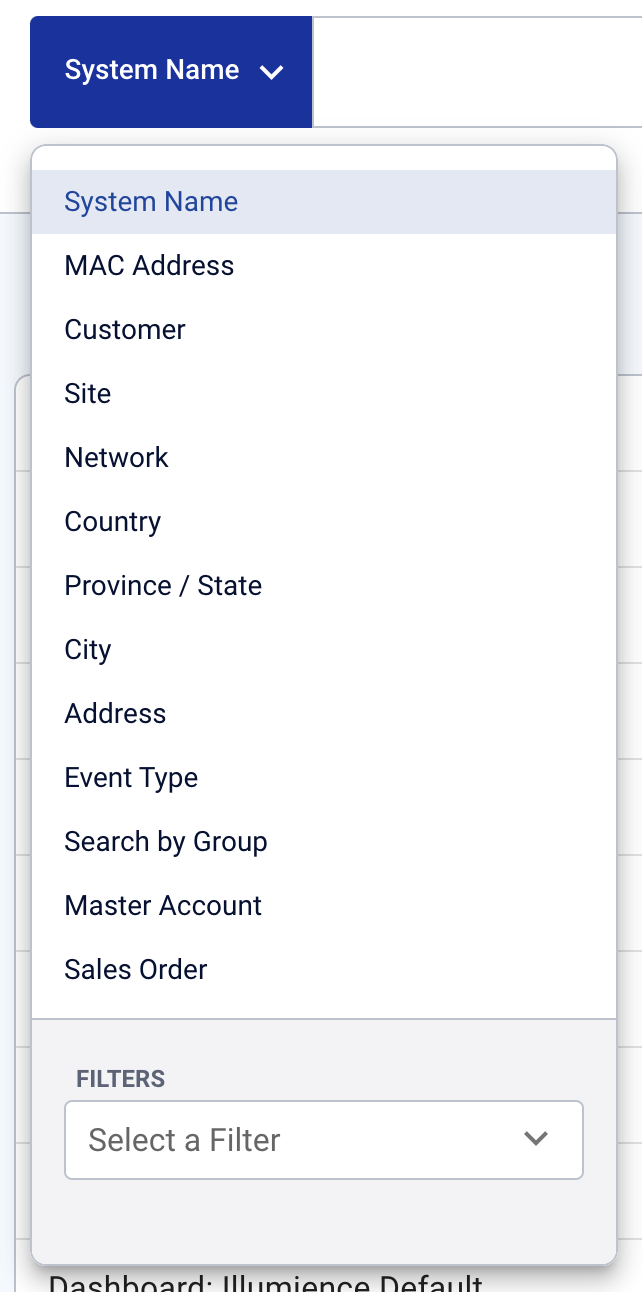
There are several search options available, such as system name, site, network, and country. Two noteworthy choices include the Event Type, which enables you to search for systems in Energy Management, and Search By Group, allowing you to group systems together for more targeted searches.
Refined Results
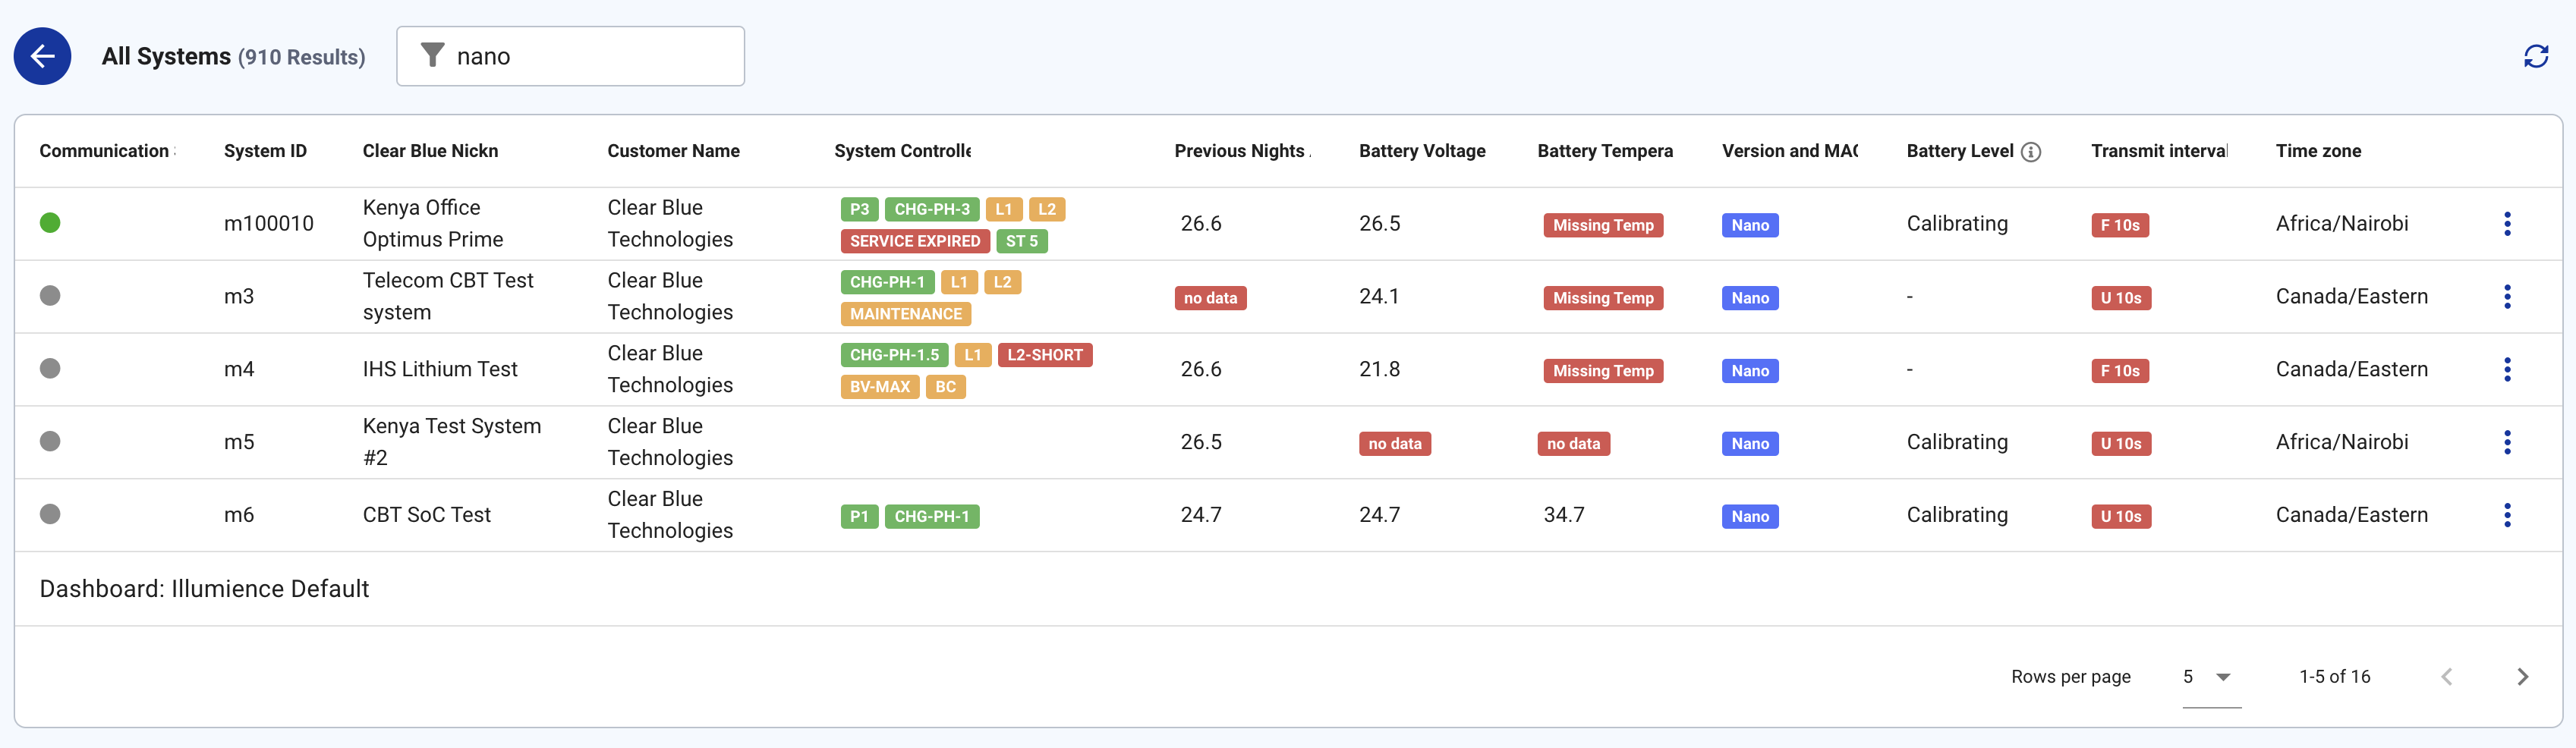
Refined results can further narrow down results by searching through all of the displayed fields. Some useful ways to use this tool are to search by:
- Charge phase (ex. "chg-ph-1") to filter by controllers in certain charge phases.
- Low voltage disconnect (ex. "LVD") to filter by controller with low energy levels.
- System type (ex. "Nano") to filter by type of system (ie. Nano, Pico or Senti) if you happen to own multiple types of systems.